 5
5peptides
spectra
0.000 | 0.000
0.000 | 0.000
0.000 | 0.000
0.355 | 0.437
0.309 | 0.398
0.000 | 0.000
0.218 | 0.248
0.000 | 0.015
| Plot | Mito | Lyso | Perox | ER | Golgi | PM | Cytosol | Nucleus | |||||
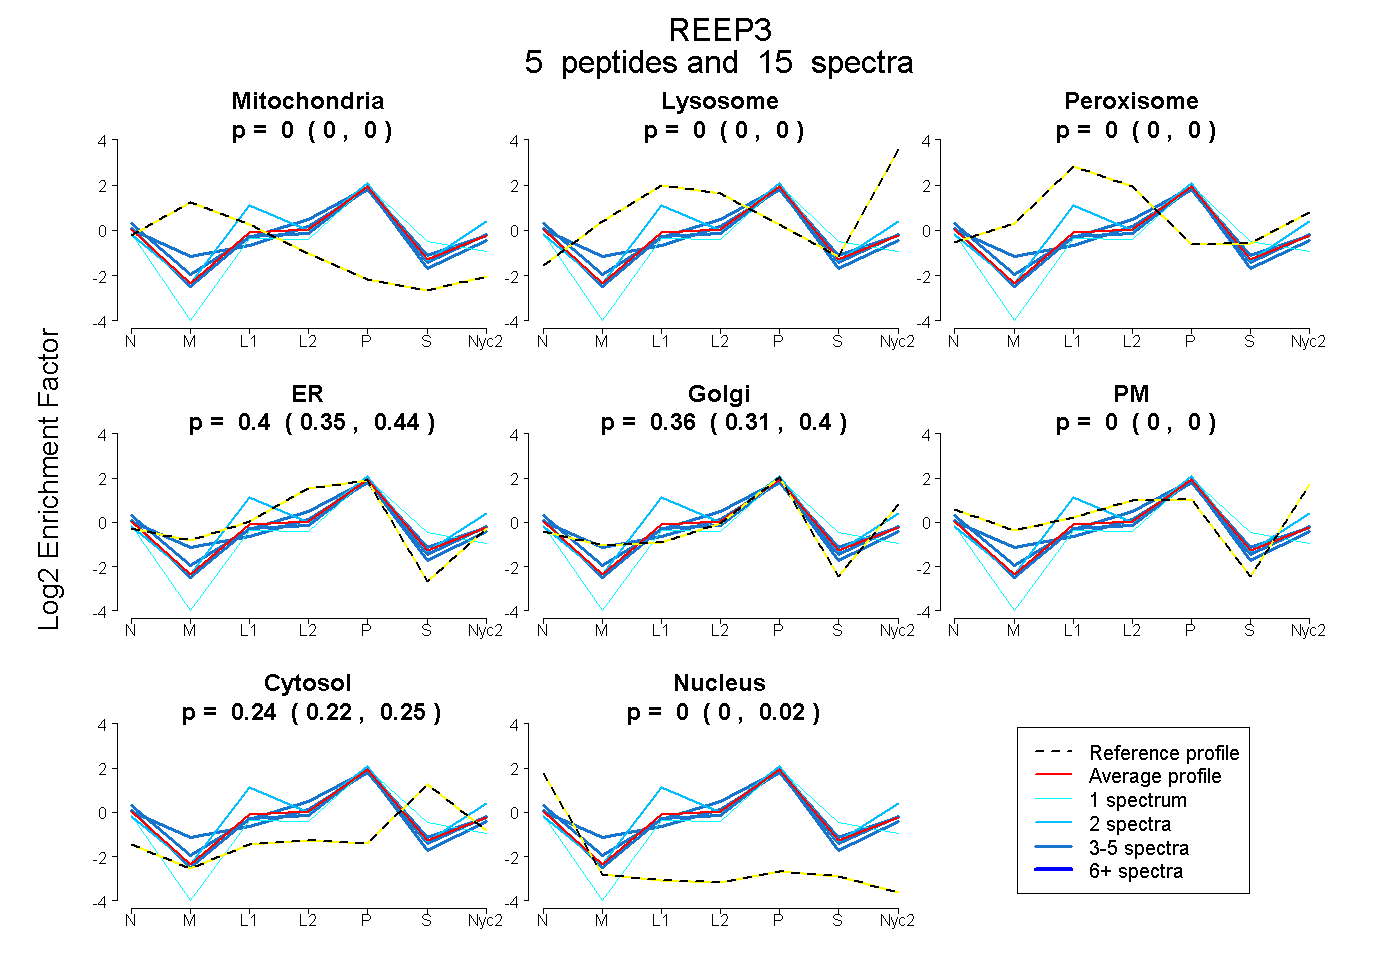
| Expt A |
5 peptides |
15 spectra |
|
0.000 0.000 | 0.000 |
0.000 0.000 | 0.000 |
0.000 0.000 | 0.000 |
0.400 0.355 | 0.437 |
0.360 0.309 | 0.398 |
0.000 0.000 | 0.000 |
0.235 0.218 | 0.248 |
0.004 0.000 | 0.015 |
| 4 spectra, FLHPLLSSK | 0.000 | 0.000 | 0.000 | 0.581 | 0.232 | 0.000 | 0.130 | 0.057 | ||
| 4 spectra, GYETMVNFGR | 0.000 | 0.000 | 0.000 | 0.297 | 0.432 | 0.000 | 0.262 | 0.008 | ||
| 2 spectra, SQGAITER | 0.000 | 0.000 | 0.183 | 0.164 | 0.544 | 0.000 | 0.109 | 0.000 | ||
| 1 spectrum, QGLNLAAAAAVTAAVK | 0.000 | 0.000 | 0.000 | 0.305 | 0.234 | 0.000 | 0.436 | 0.024 | ||
| 4 spectra, GASLLYR | 0.000 | 0.000 | 0.000 | 0.368 | 0.449 | 0.000 | 0.164 | 0.019 |
| Plot | Mito | Lyso or Perox | ER | Golgi | PM | Cytosol | Nucleus | ||||||
| Expt B |
5 peptides |
10 spectra |
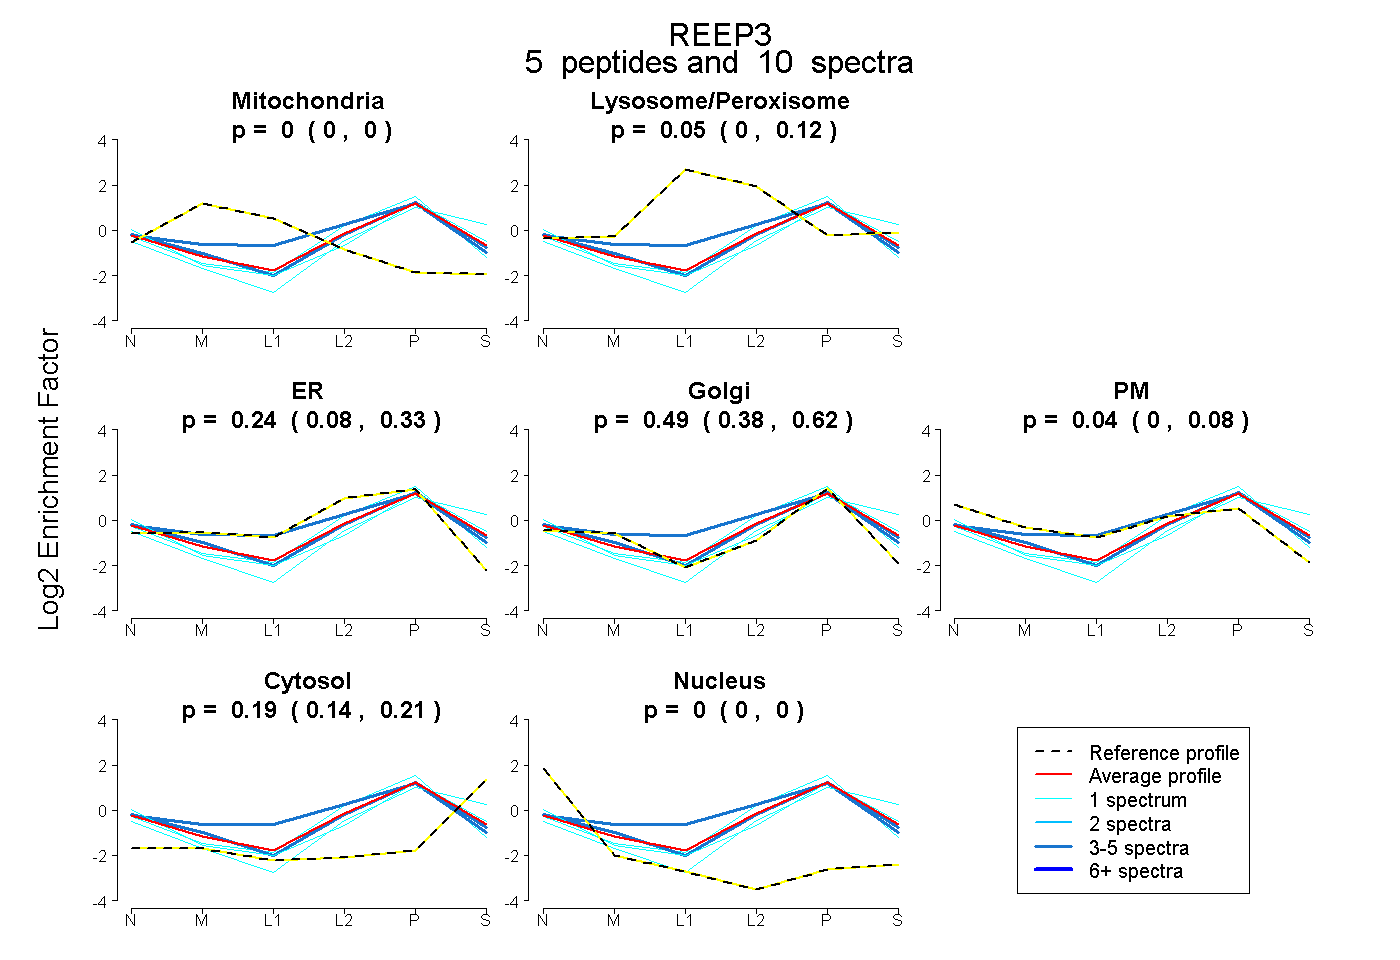 |
0.000 0.000 | 0.000 |
0.047 0.000 | 0.124 |
0.239 0.081 | 0.331 |
0.486 0.384 | 0.616 |
0.043 0.000 | 0.080 |
0.185 0.141 | 0.213 |
0.000 0.000 | 0.000 |
|||
| Plot | Lyso | Other | |||||||||||
| Expt C |
5 peptides |
12 spectra |
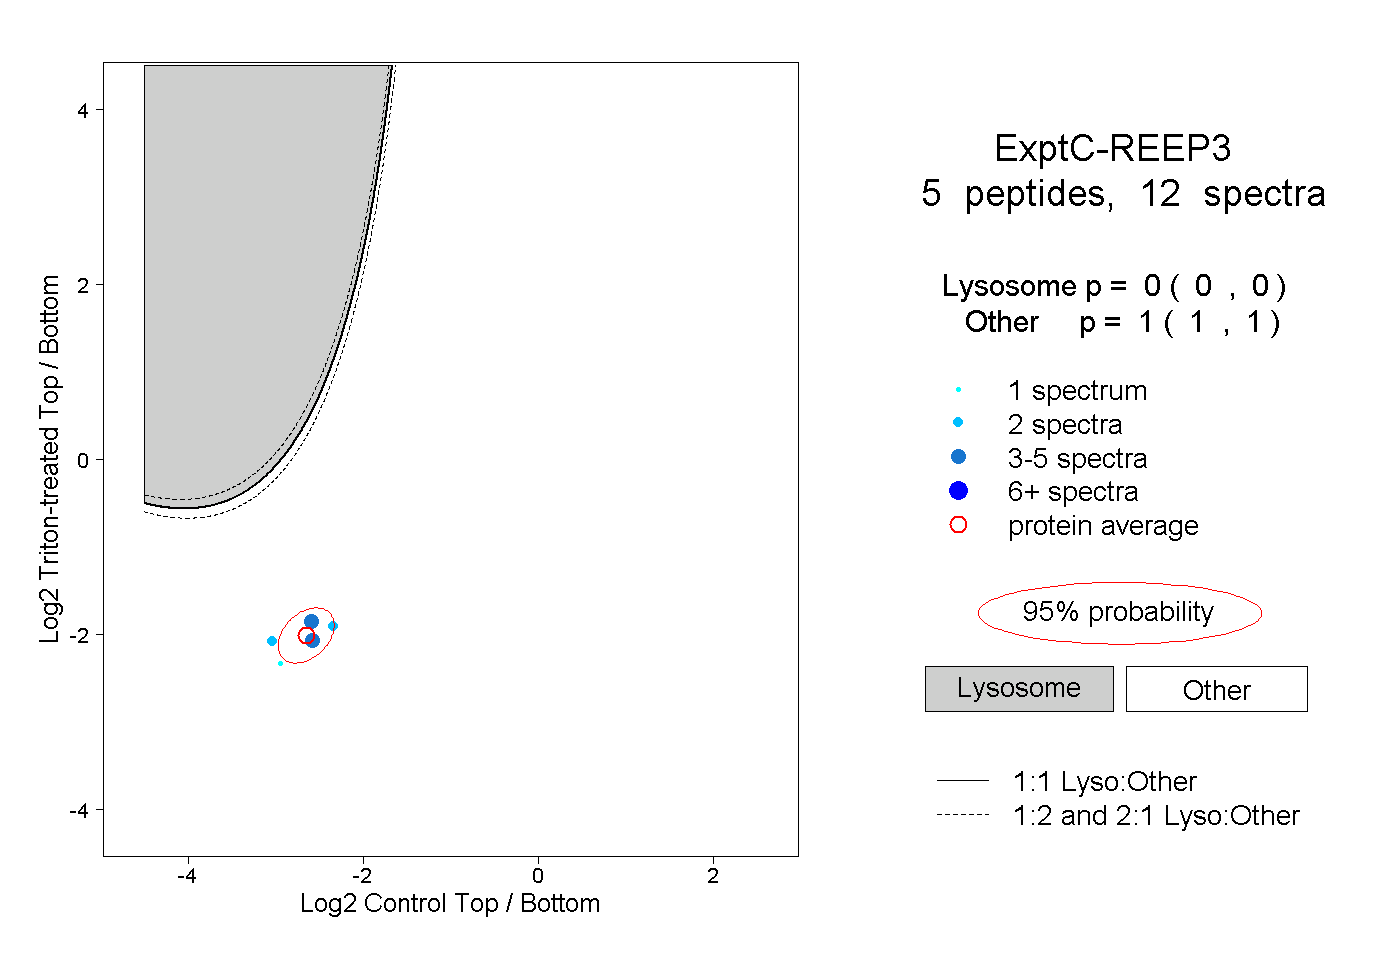 |
0.000 0.000 | 0.000 |
1.000 1.000 | 1.000 |
||||||||
| Plot | Lyso | Other | |||||||||||
| Expt D |
1 peptide |
2 spectra |
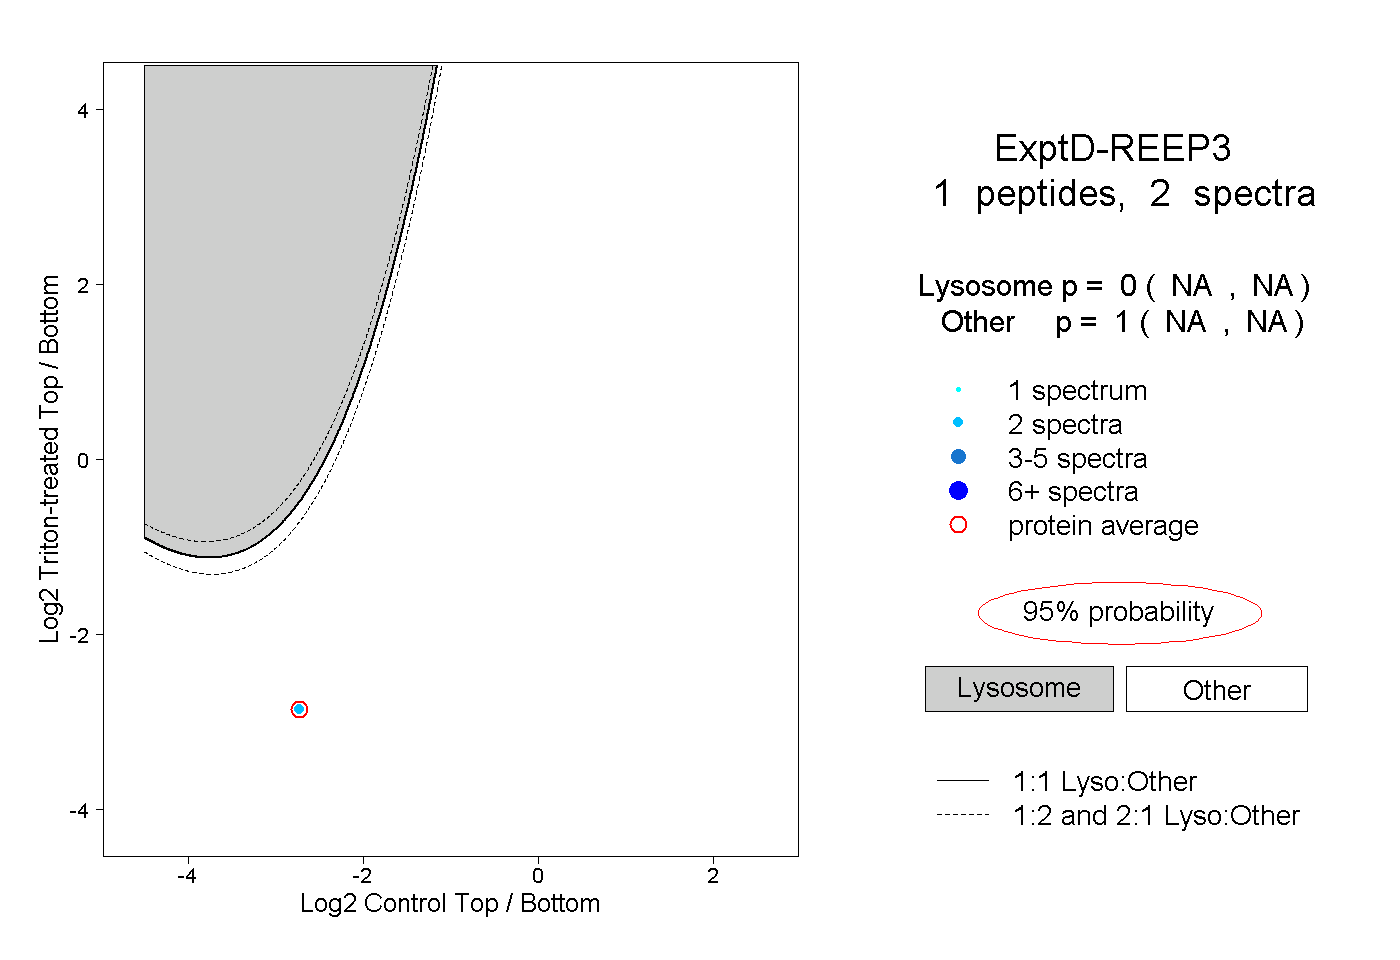 |
0.000 NA | NA |
1.000 NA | NA |