 7
7peptides
spectra
0.027 | 0.045
0.000 | 0.000
0.232 | 0.244
0.000 | 0.000
0.195 | 0.206
0.000 | 0.000
0.516 | 0.531
0.000 | 0.000
| Plot | Mito | Lyso | Perox | ER | Golgi | PM | Cytosol | Nucleus | |||||
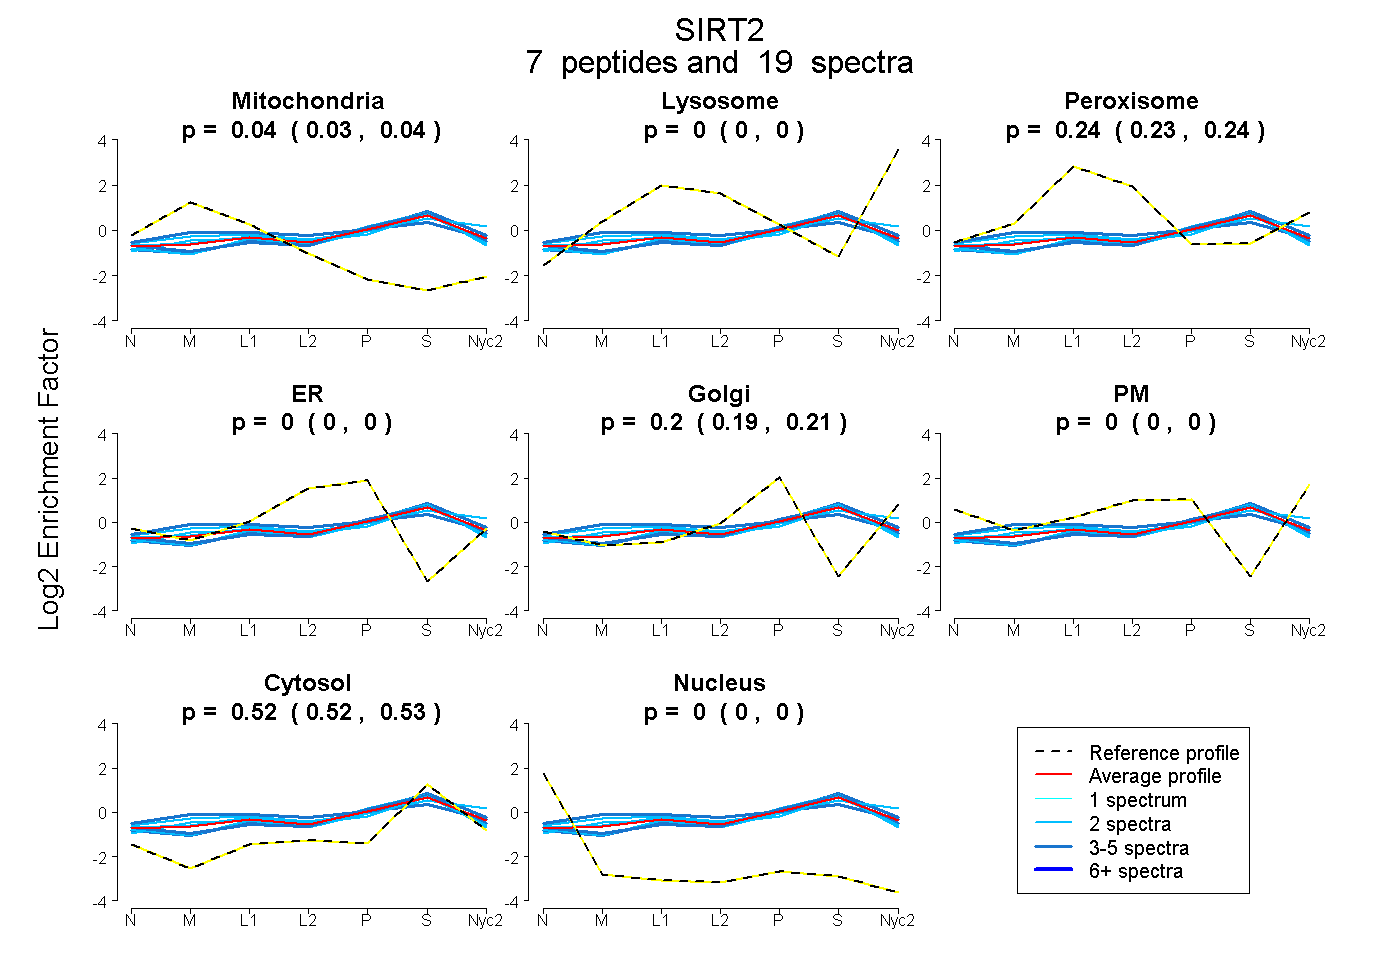
| Expt A |
7 peptides |
19 spectra |
|
0.037 0.027 | 0.045 |
0.000 0.000 | 0.000 |
0.239 0.232 | 0.244 |
0.000 0.000 | 0.000 |
0.201 0.195 | 0.206 |
0.000 0.000 | 0.000 |
0.523 0.516 | 0.531 |
0.000 0.000 | 0.000 |
| 2 spectra, SPSTGLYANLEK | 0.076 | 0.000 | 0.248 | 0.000 | 0.143 | 0.000 | 0.533 | 0.000 | ||
| 2 spectra, EYTMSWMK | 0.068 | 0.009 | 0.216 | 0.000 | 0.179 | 0.000 | 0.528 | 0.000 | ||
| 4 spectra, LLDELTLEGVTR | 0.012 | 0.000 | 0.182 | 0.000 | 0.229 | 0.000 | 0.576 | 0.000 | ||
| 2 spectra, ELEDLVR | 0.002 | 0.000 | 0.188 | 0.078 | 0.133 | 0.000 | 0.600 | 0.000 | ||
| 3 spectra, NLFTQTLGLGSQK | 0.107 | 0.000 | 0.293 | 0.000 | 0.207 | 0.000 | 0.393 | 0.000 | ||
| 2 spectra, HPEPFFALAK | 0.060 | 0.094 | 0.215 | 0.000 | 0.176 | 0.000 | 0.455 | 0.000 | ||
| 4 spectra, APLATPR | 0.000 | 0.000 | 0.208 | 0.000 | 0.202 | 0.000 | 0.591 | 0.000 |
| Plot | Mito | Lyso or Perox | ER | Golgi | PM | Cytosol | Nucleus | ||||||
| Expt B |
3 peptides |
5 spectra |
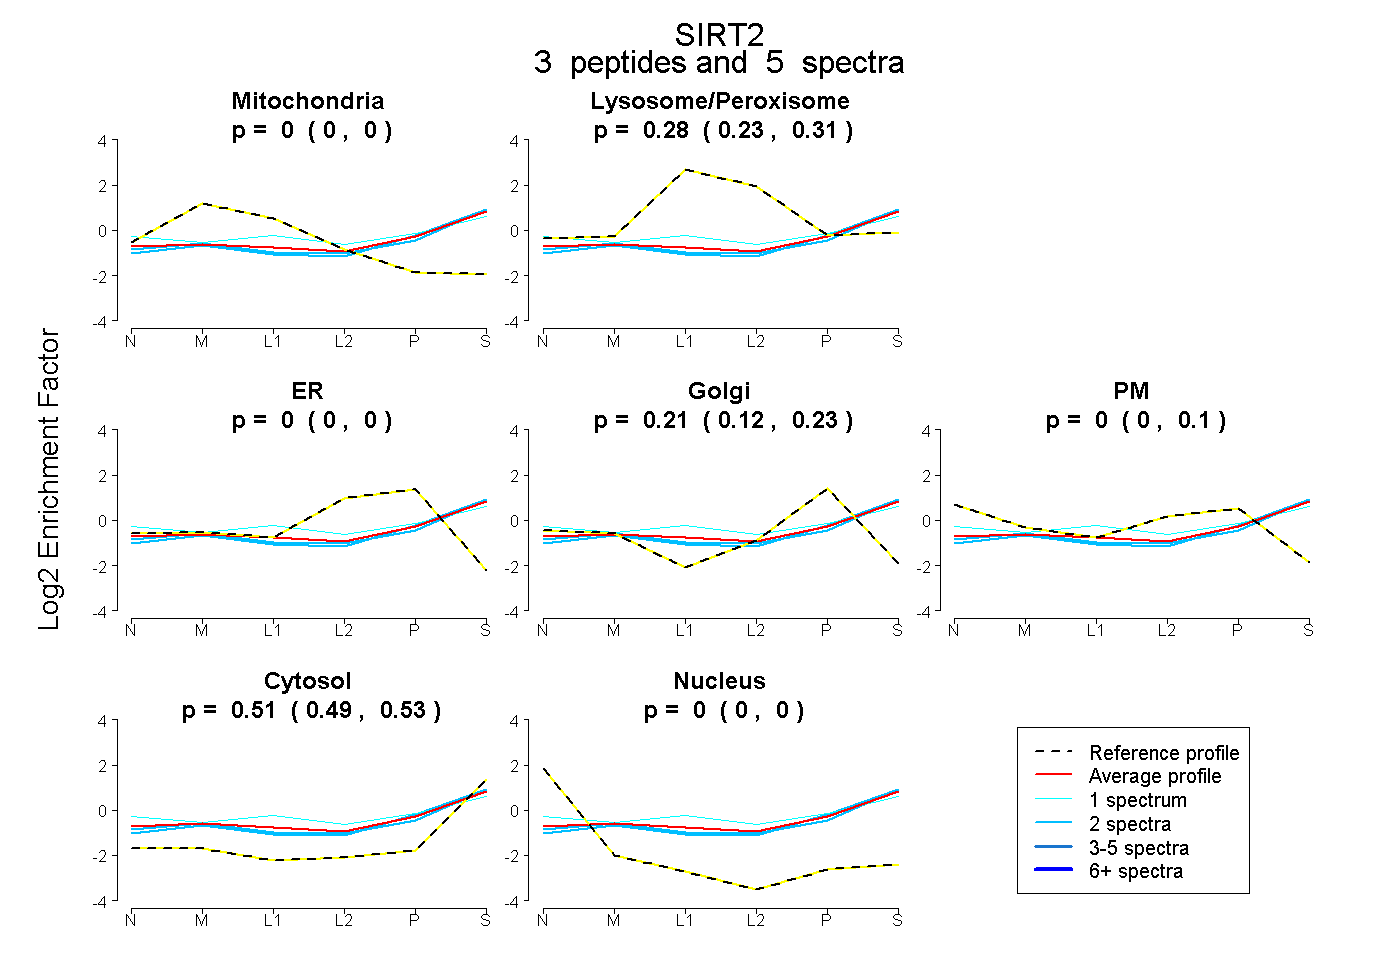 |
0.000 0.000 | 0.000 |
0.283 0.227 | 0.310 |
0.000 0.000 | 0.000 |
0.209 0.125 | 0.228 |
0.000 0.000 | 0.100 |
0.508 0.486 | 0.528 |
0.000 0.000 | 0.000 |
|||
| Plot | Lyso | Other | |||||||||||
| Expt C |
7 peptides |
38 spectra |
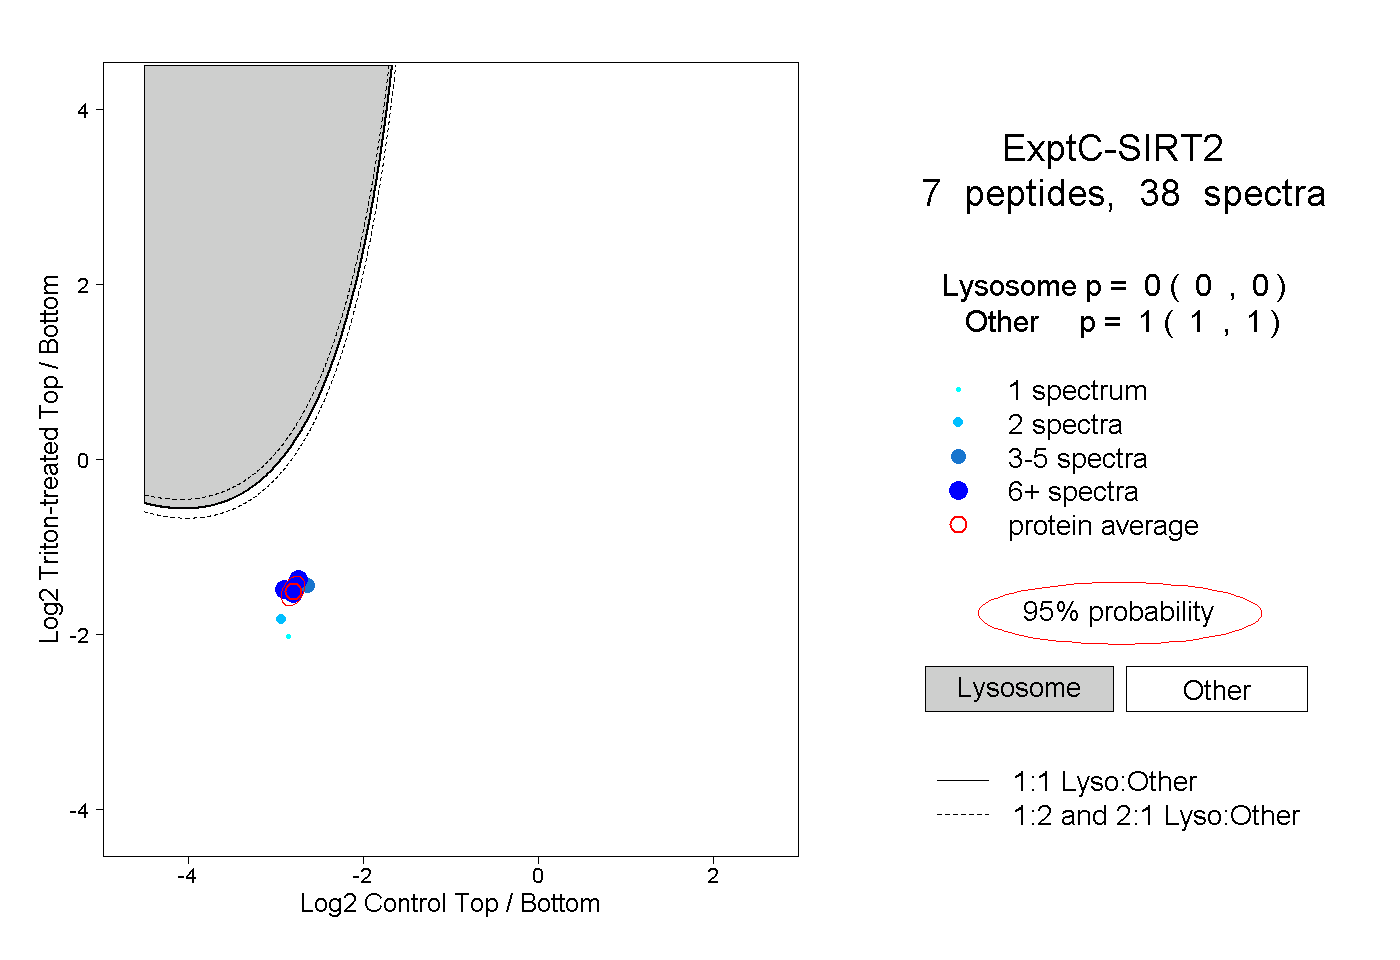 |
0.000 0.000 | 0.000 |
1.000 1.000 | 1.000 |
||||||||
| Plot | Lyso | Other | |||||||||||
| Expt D |
2 peptides |
3 spectra |
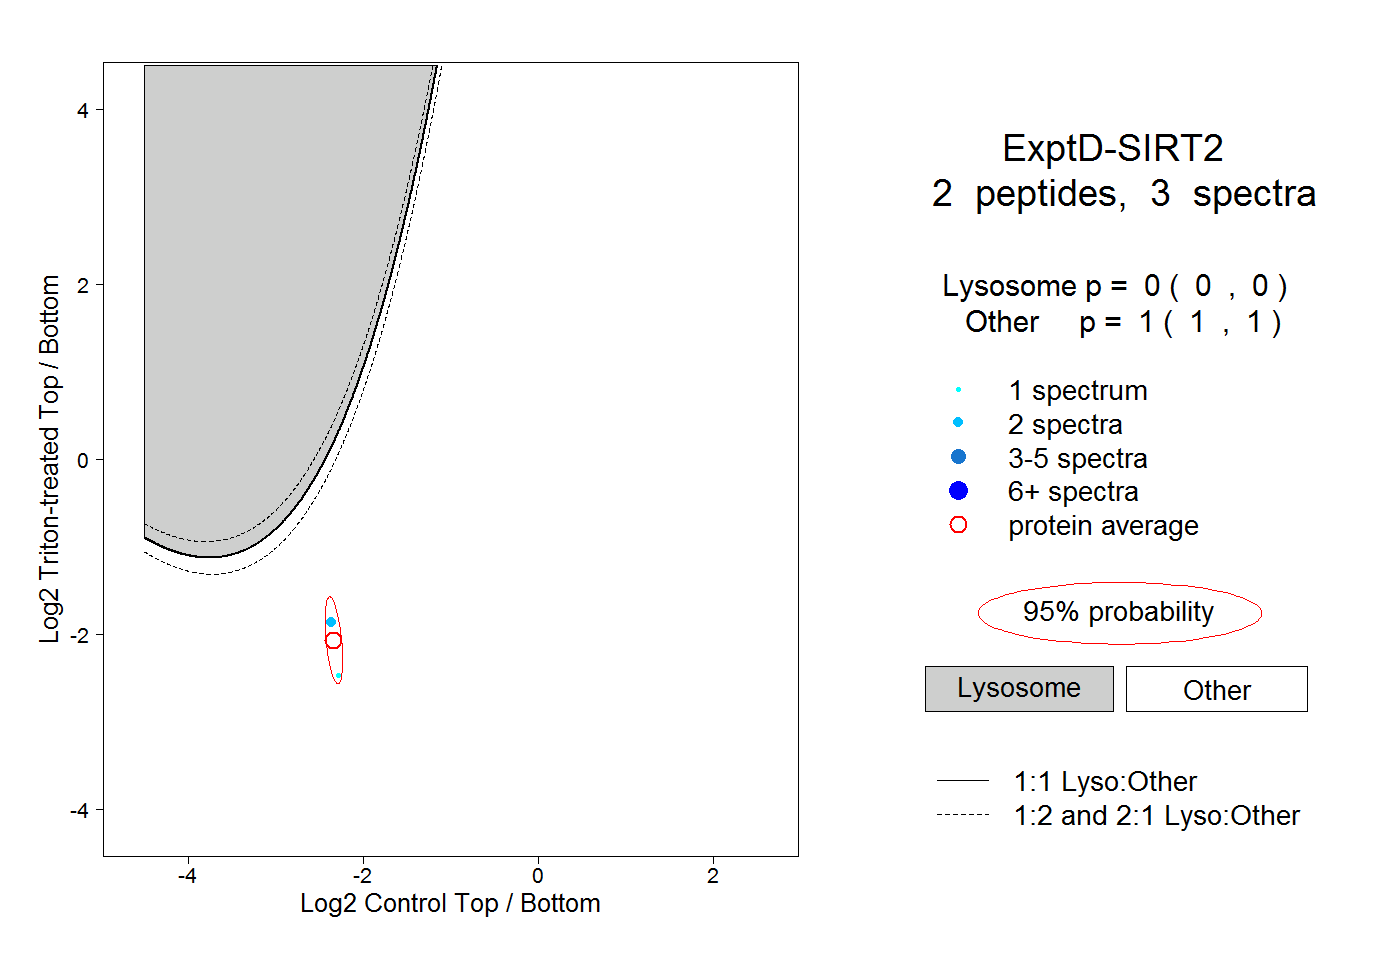 |
0.000 0.000 | 0.000 |
1.000 1.000 | 1.000 |