 2
2peptides
spectra
0.000 | 0.109
0.000 | 0.135
0.000 | 0.324
0.000 | 0.138
0.000 | 0.027
0.309 | 0.731
0.000 | 0.265
0.000 | 0.190
1peptide
spectra
NA | NA
NA | NA
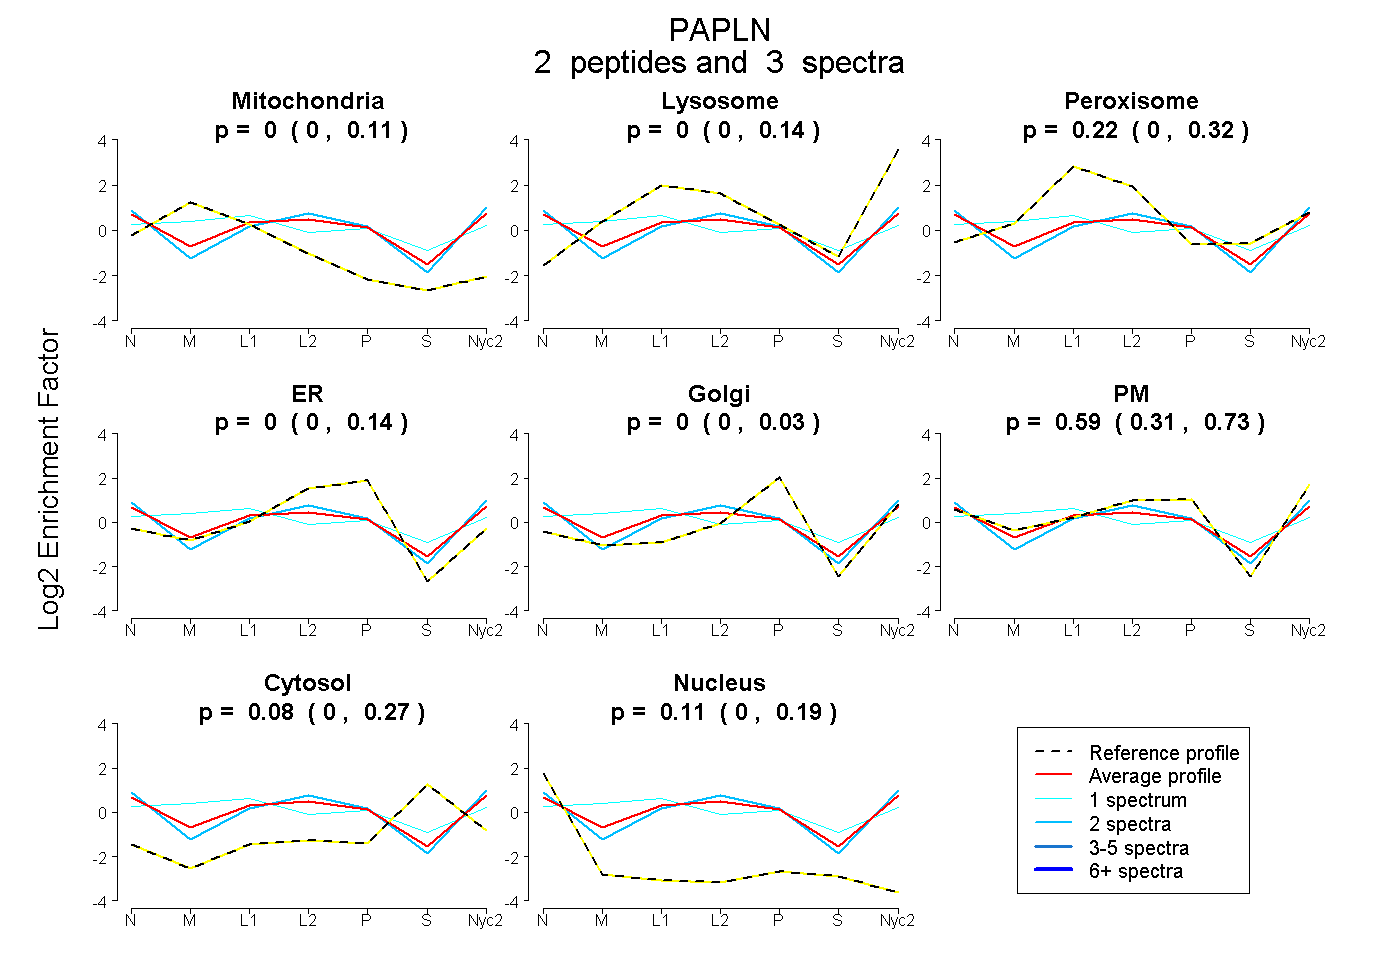
| Plot | Mito | Lyso | Perox | ER | Golgi | PM | Cytosol | Nucleus | |||||
| Expt A |
2 peptides |
3 spectra |
|
0.000 0.000 | 0.109 |
0.000 0.000 | 0.135 |
0.217 0.000 | 0.324 |
0.000 0.000 | 0.138 |
0.000 0.000 | 0.027 |
0.587 0.309 | 0.731 |
0.084 0.000 | 0.265 |
0.111 0.000 | 0.190 |
||
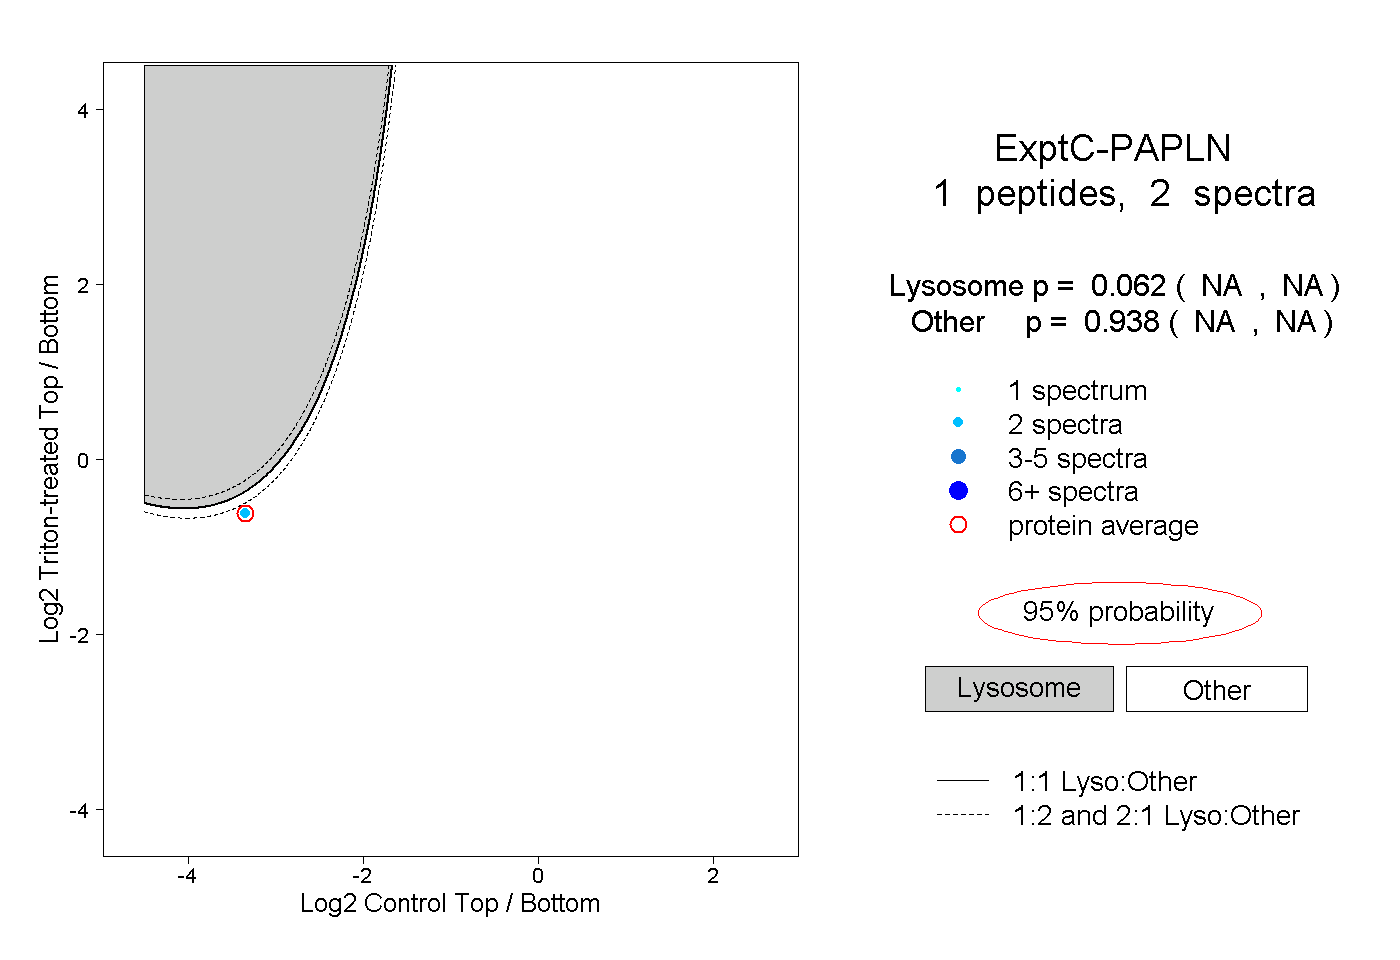
| Plot | Lyso | Other | |||||||||||
| Expt C |
1 peptide |
2 spectra |
|
0.062 NA | NA |
0.938 NA | NA |