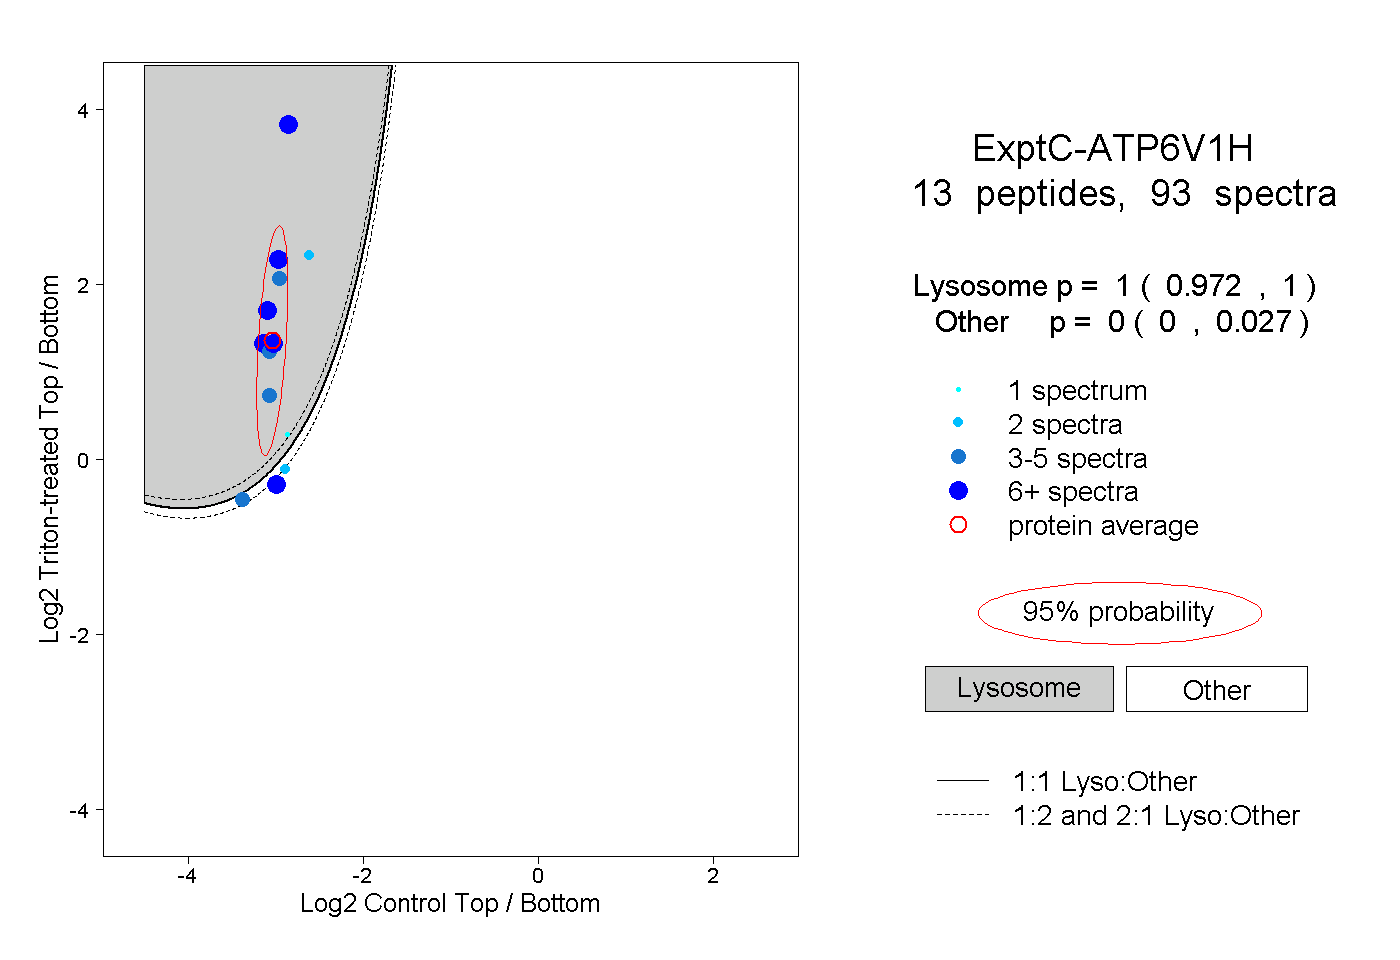
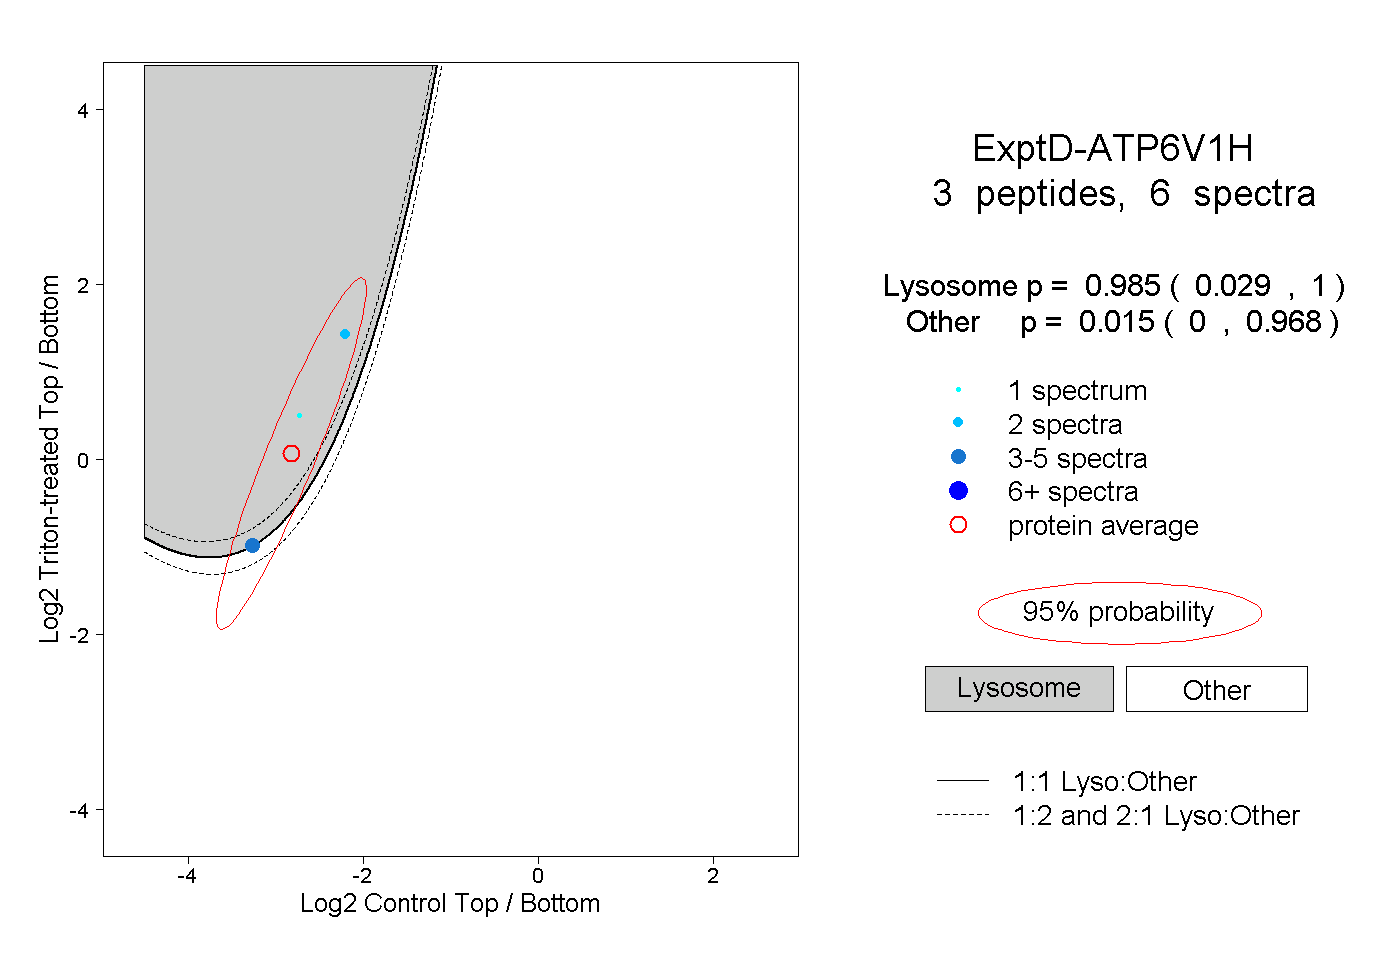
ATP6V1H
[ENSRNOP00000059400]
Main page
| | | Plot |
Mito |
Lyso |
|
Perox |
ER |
Golgi |
PM |
Cytosol |
Nucleus |
|
| Expt A |
 16
16
peptides |
32
spectra |
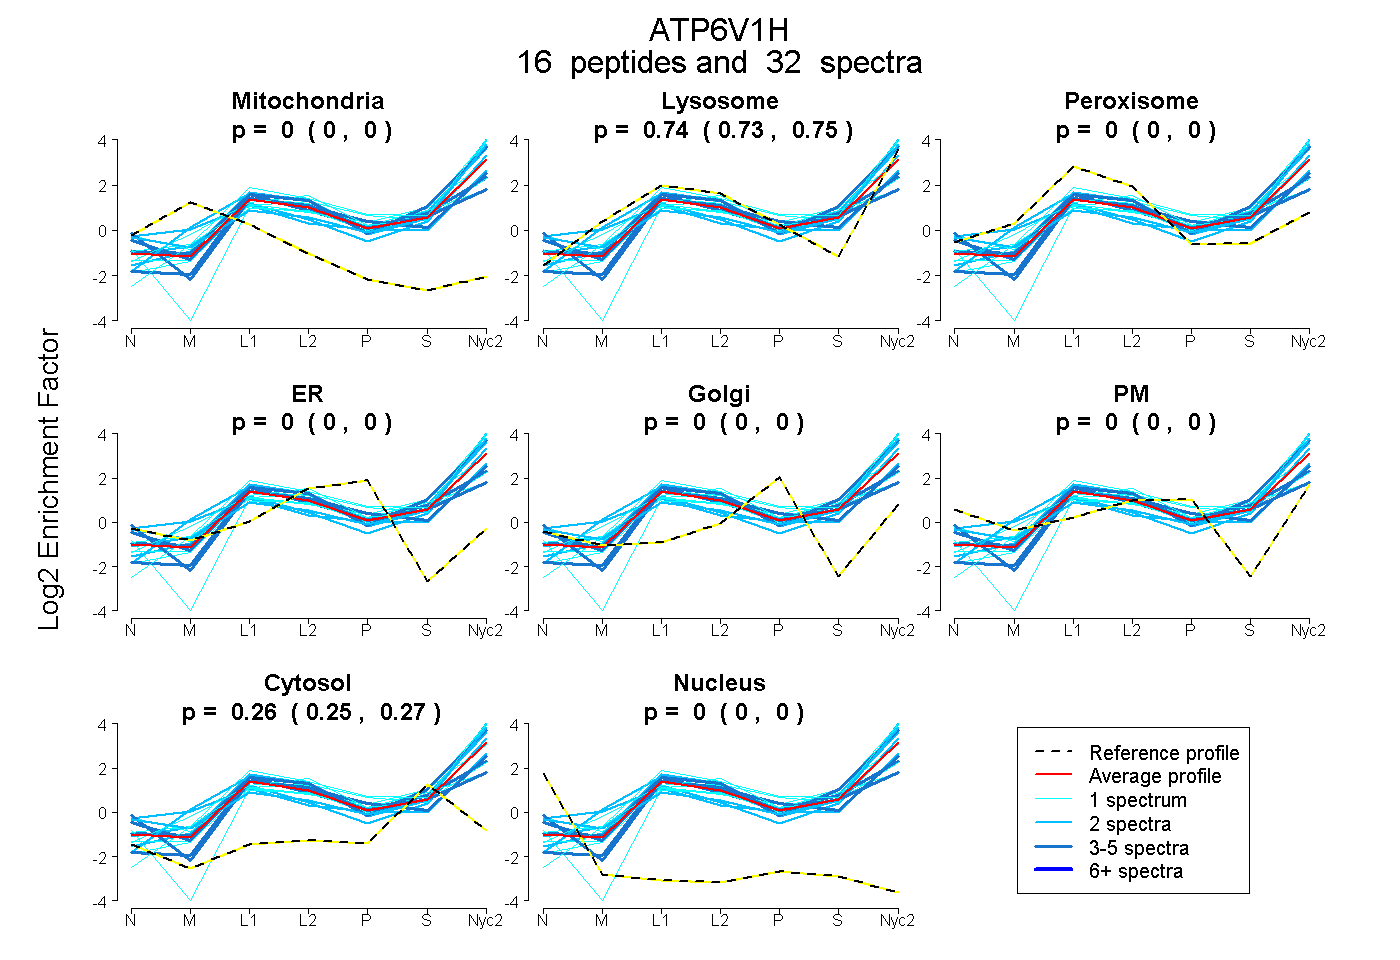 |
0.000
0.000 | 0.000 |
0.740
0.733 | 0.745 |
|
0.000
0.000 | 0.000 |
0.000
0.000 | 0.000 |
0.000
0.000 | 0.000 |
0.000
0.000 | 0.000 |
0.260
0.253 | 0.266 |
0.000
0.000 | 0.000 |
|
| | | Plot |
Mito |
|
Lyso or Perox |
|
ER |
Golgi |
PM |
Cytosol |
Nucleus |
|
| Expt B |
5
peptides |
7
spectra |
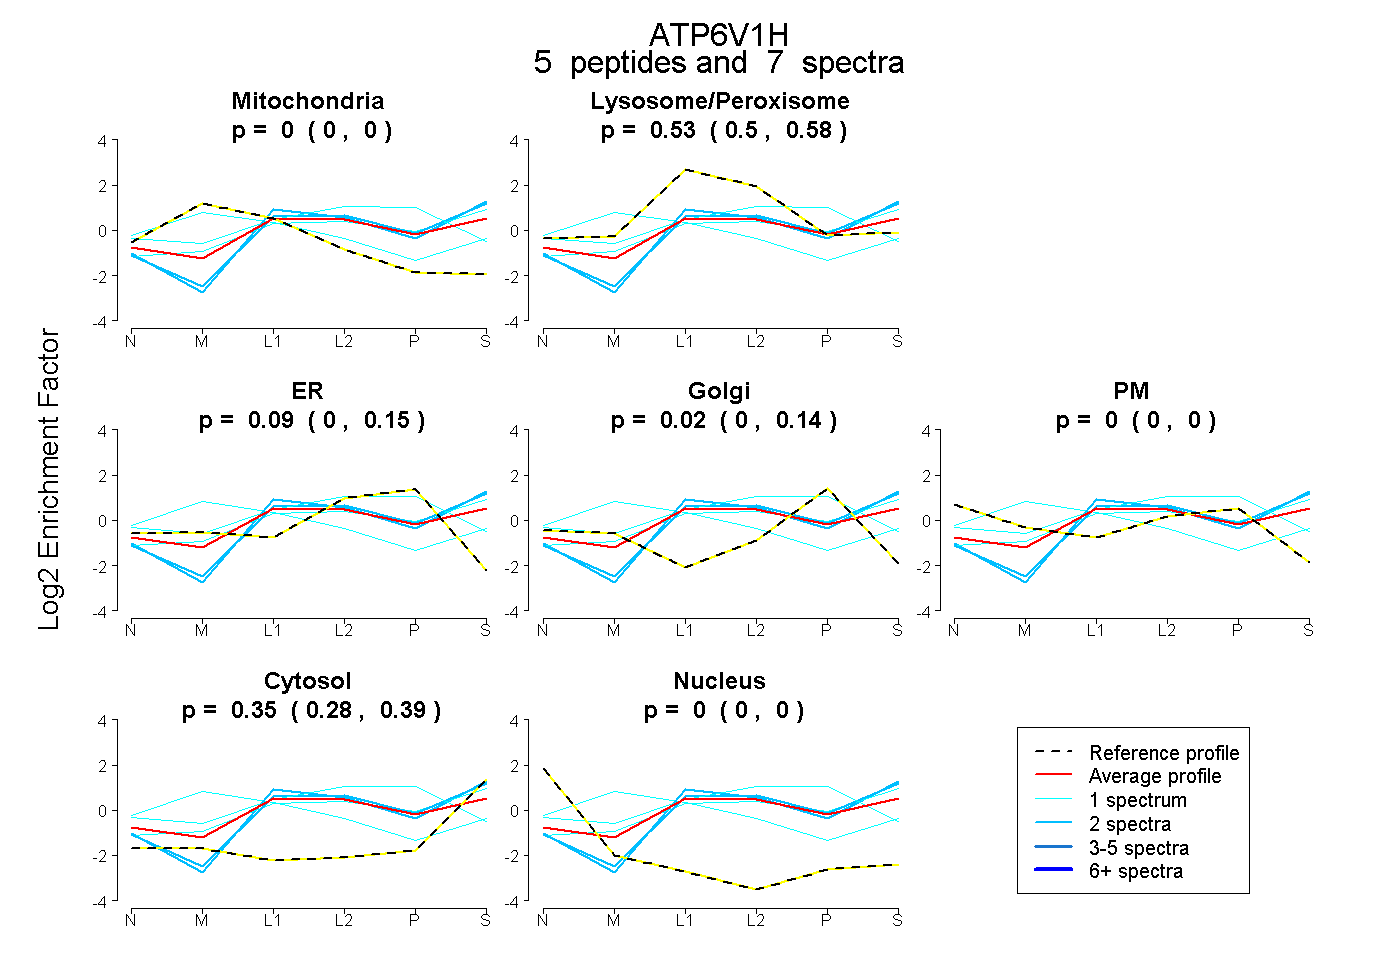 |
0.000
0.000 | 0.000 |
|
0.535
0.497 | 0.576 |
|
0.089
0.000 | 0.145 |
0.024
0.000 | 0.142 |
0.000
0.000 | 0.000 |
0.352
0.284 | 0.385 |
0.000
0.000 | 0.000 |
|
| | | Plot |
|
Lyso |
|
|
|
|
|
|
|
Other |
| Expt C |
13
peptides |
93
spectra |
 |
|
1.000
0.972 | 1.000 |
|
|
|
|
|
|
|
0.000
0.000 | 0.027 |
| 12 spectra, TQLSSQK |
|
1.000 |
|
|
|
|
|
|
|
0.000 |
| 2 spectra, QLQSEQPQTAAAR |
|
1.000 |
|
|
|
|
|
|
|
0.000 |
| 5 spectra, LMVHNWEYLGK |
|
0.312 |
|
|
|
|
|
|
|
0.688 |
| 4 spectra, VIEQLGGK |
|
1.000 |
|
|
|
|
|
|
|
0.000 |
| 2 spectra, QEMLQTEGSQCAK |
|
0.162 |
|
|
|
|
|
|
|
0.838 |
| 4 spectra, VSIFFDYAK |
|
1.000 |
|
|
|
|
|
|
|
0.000 |
| 10 spectra, YNALLAVQK |
|
1.000 |
|
|
|
|
|
|
|
0.000 |
| 7 spectra, YDDEDISEDIK |
|
1.000 |
|
|
|
|
|
|
|
0.000 |
| 10 spectra, LAAWGK |
|
1.000 |
|
|
|
|
|
|
|
0.000 |
| 12 spectra, QDPFTVHMAAR |
|
0.113 |
|
|
|
|
|
|
|
0.887 |
| 5 spectra, STAWPYFLPMLNR |
|
1.000 |
|
|
|
|
|
|
|
0.000 |
| 19 spectra, IILAAFR |
|
1.000 |
|
|
|
|
|
|
|
0.000 |
| 1 spectrum, QEYALAMIQCK |
|
0.854 |
|
|
|
|
|
|
|
0.146 |
| | | Plot |
|
Lyso |
|
|
|
|
|
|
|
Other |
| Expt D |
3
peptides |
6
spectra |
 |
|
0.985
0.029 | 1.000 |
|
|
|
|
|
|
|
0.015
0.000 | 0.968 |