 16
16peptides
spectra
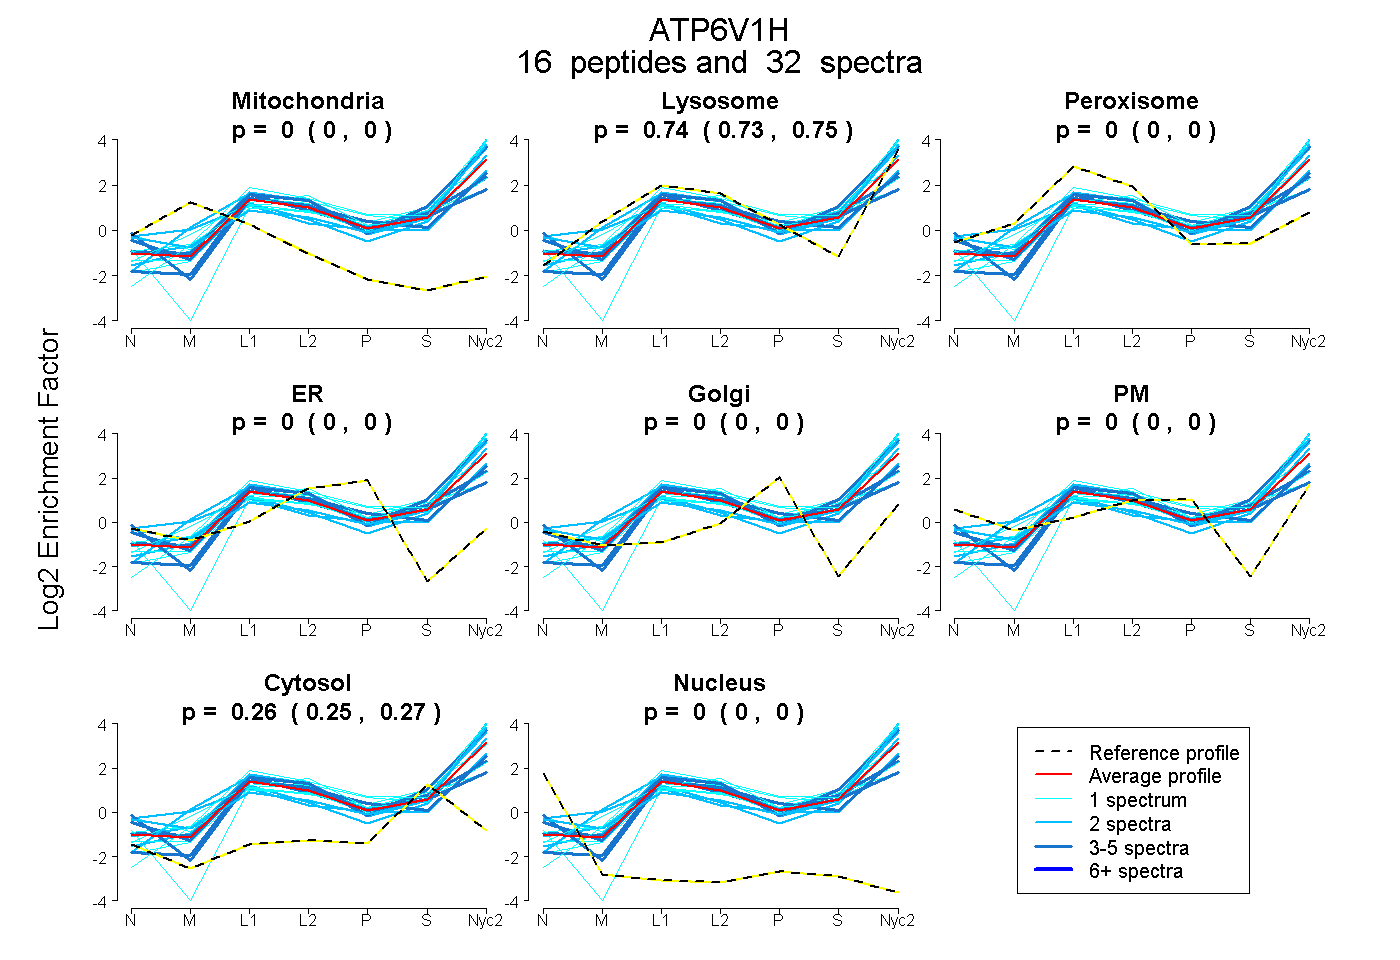
0.000 | 0.000
0.733 | 0.745
0.000 | 0.000
0.000 | 0.000
0.000 | 0.000
0.000 | 0.000
0.253 | 0.266
0.000 | 0.000
| Plot | Mito | Lyso | Perox | ER | Golgi | PM | Cytosol | Nucleus | |||||
| Expt A |
16 peptides |
32 spectra |
|
0.000 0.000 | 0.000 |
0.740 0.733 | 0.745 |
0.000 0.000 | 0.000 |
0.000 0.000 | 0.000 |
0.000 0.000 | 0.000 |
0.000 0.000 | 0.000 |
0.260 0.253 | 0.266 |
0.000 0.000 | 0.000 |
| 1 spectrum, YNIIPVLSDILQESVK | 0.000 | 0.902 | 0.000 | 0.000 | 0.000 | 0.000 | 0.098 | 0.000 | ||
| 3 spectra, QLQSEQPQTAAAR | 0.000 | 0.315 | 0.253 | 0.000 | 0.000 | 0.092 | 0.340 | 0.000 | ||
| 4 spectra, LMVHNWEYLGK | 0.000 | 0.573 | 0.135 | 0.000 | 0.000 | 0.000 | 0.291 | 0.000 | ||
| 1 spectrum, QEMLQTEGSQCAK | 0.000 | 0.494 | 0.121 | 0.000 | 0.000 | 0.083 | 0.302 | 0.000 | ||
| 3 spectra, VSIFFDYAK | 0.000 | 0.744 | 0.000 | 0.000 | 0.000 | 0.000 | 0.256 | 0.000 | ||
| 2 spectra, GAVDAAVPTNIIAAK | 0.000 | 0.810 | 0.000 | 0.000 | 0.000 | 0.000 | 0.190 | 0.000 | ||
| 2 spectra, STAWPYFLPMLNR | 0.000 | 0.902 | 0.000 | 0.000 | 0.000 | 0.000 | 0.098 | 0.000 | ||
| 2 spectra, LLEVSDDPQVLAVAAHDVGEYVR | 0.000 | 0.608 | 0.018 | 0.000 | 0.000 | 0.148 | 0.226 | 0.000 | ||
| 5 spectra, QLVMNHMHHEDQQVR | 0.000 | 0.565 | 0.081 | 0.000 | 0.000 | 0.116 | 0.239 | 0.000 | ||
| 2 spectra, ELMEGSDLNYYFNWIK | 0.000 | 0.728 | 0.000 | 0.000 | 0.000 | 0.000 | 0.272 | 0.000 | ||
| 1 spectrum, VIEQLGGK | 0.000 | 0.877 | 0.000 | 0.000 | 0.000 | 0.000 | 0.123 | 0.000 | ||
| 1 spectrum, QDPFTVHMAAR | 0.000 | 0.546 | 0.000 | 0.000 | 0.000 | 0.000 | 0.454 | 0.000 | ||
| 1 spectrum, LAAWGK | 0.000 | 0.793 | 0.000 | 0.000 | 0.000 | 0.000 | 0.207 | 0.000 | ||
| 2 spectra, YDDEDISEDIK | 0.000 | 0.755 | 0.000 | 0.000 | 0.000 | 0.000 | 0.245 | 0.000 | ||
| 1 spectrum, QLENLEQQK | 0.000 | 0.848 | 0.000 | 0.000 | 0.000 | 0.000 | 0.152 | 0.000 | ||
| 1 spectrum, QEYALAMIQCK | 0.000 | 0.517 | 0.096 | 0.000 | 0.000 | 0.000 | 0.386 | 0.000 |
| Plot | Mito | Lyso or Perox | ER | Golgi | PM | Cytosol | Nucleus | ||||||
| Expt B |
5 peptides |
7 spectra |
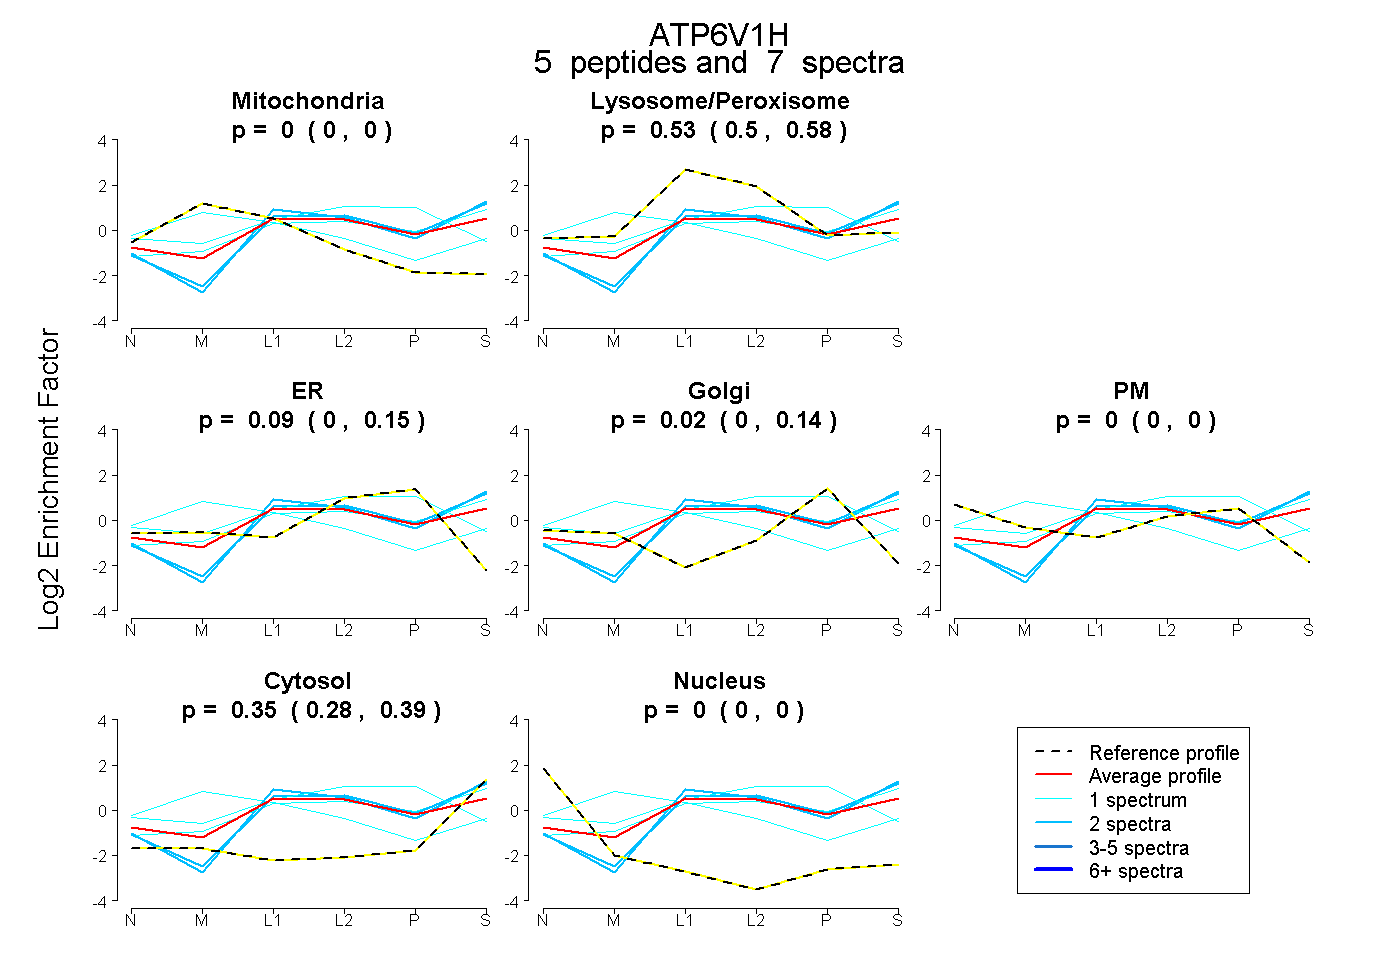 |
0.000 0.000 | 0.000 |
0.535 0.497 | 0.576 |
0.089 0.000 | 0.145 |
0.024 0.000 | 0.142 |
0.000 0.000 | 0.000 |
0.352 0.284 | 0.385 |
0.000 0.000 | 0.000 |
|||
| Plot | Lyso | Other | |||||||||||
| Expt C |
13 peptides |
93 spectra |
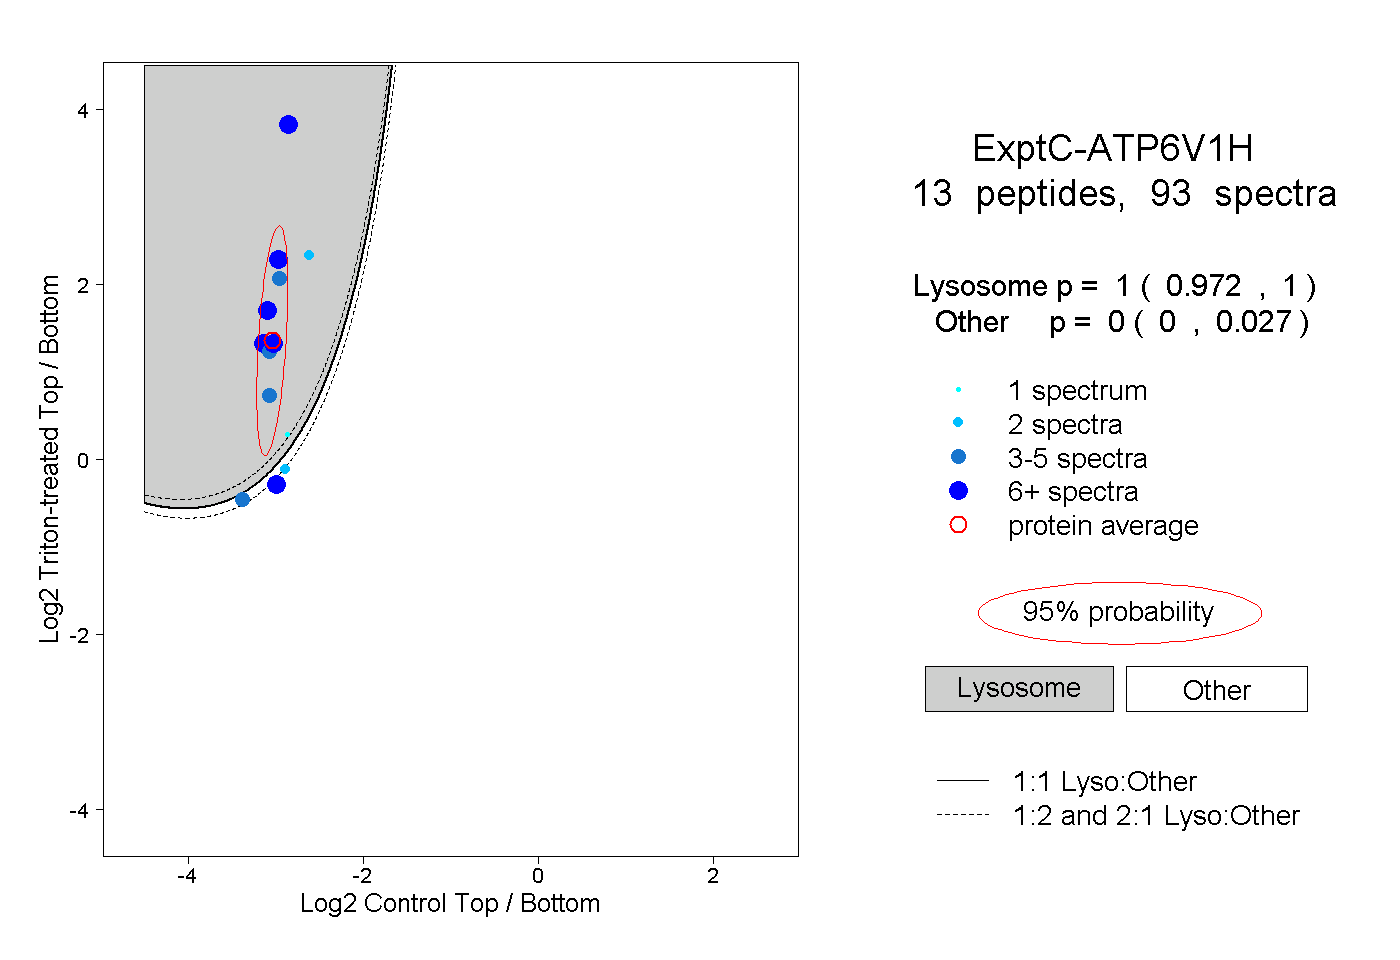 |
1.000 0.972 | 1.000 |
0.000 0.000 | 0.027 |
||||||||
| Plot | Lyso | Other | |||||||||||
| Expt D |
3 peptides |
6 spectra |
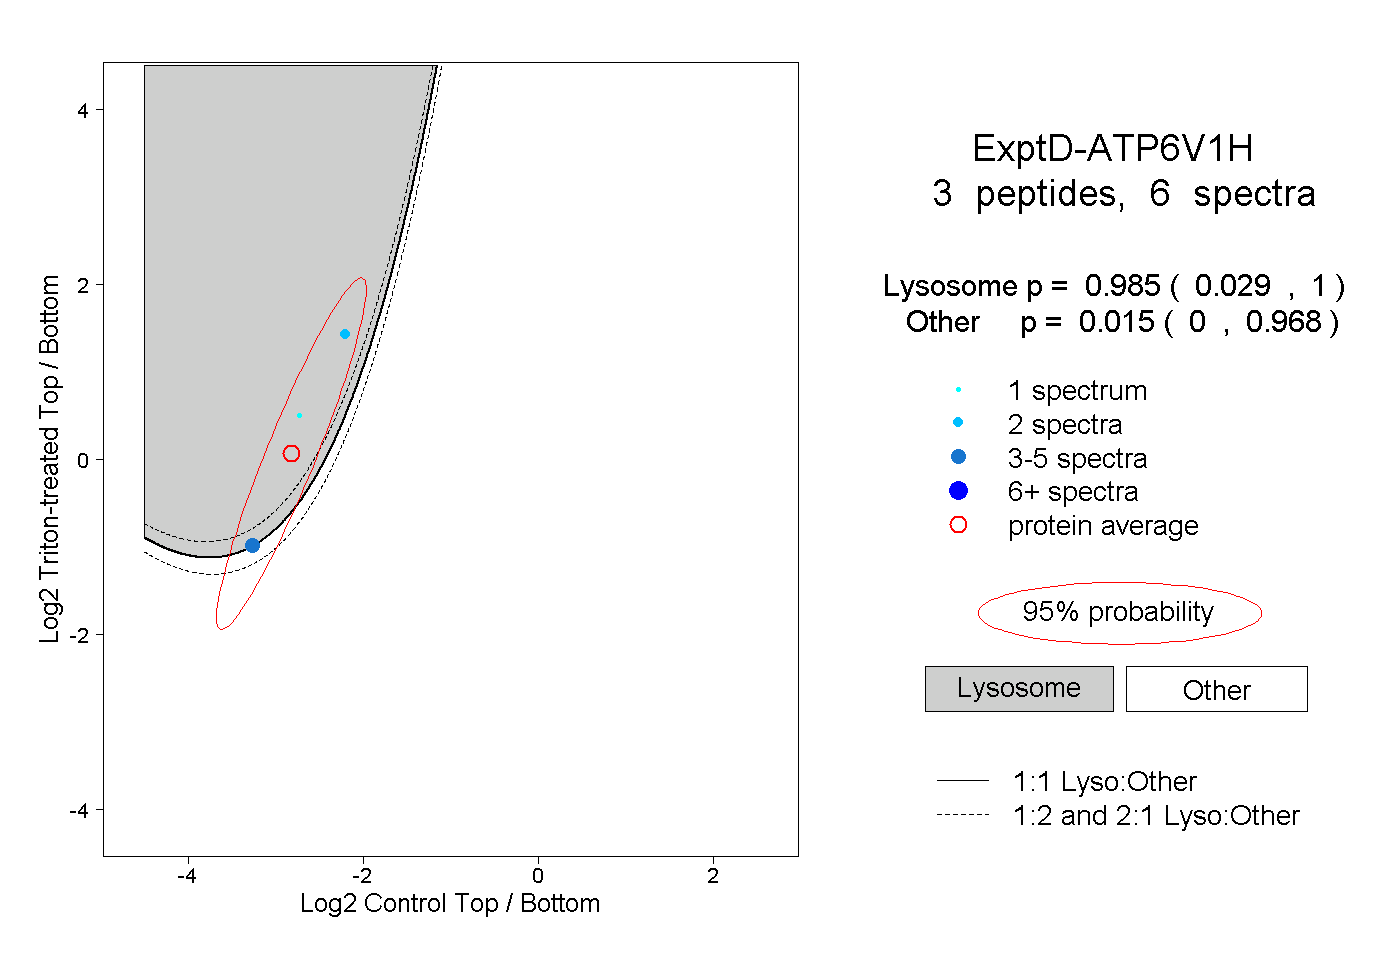 |
0.985 0.029 | 1.000 |
0.015 0.000 | 0.968 |