 16
16peptides
spectra
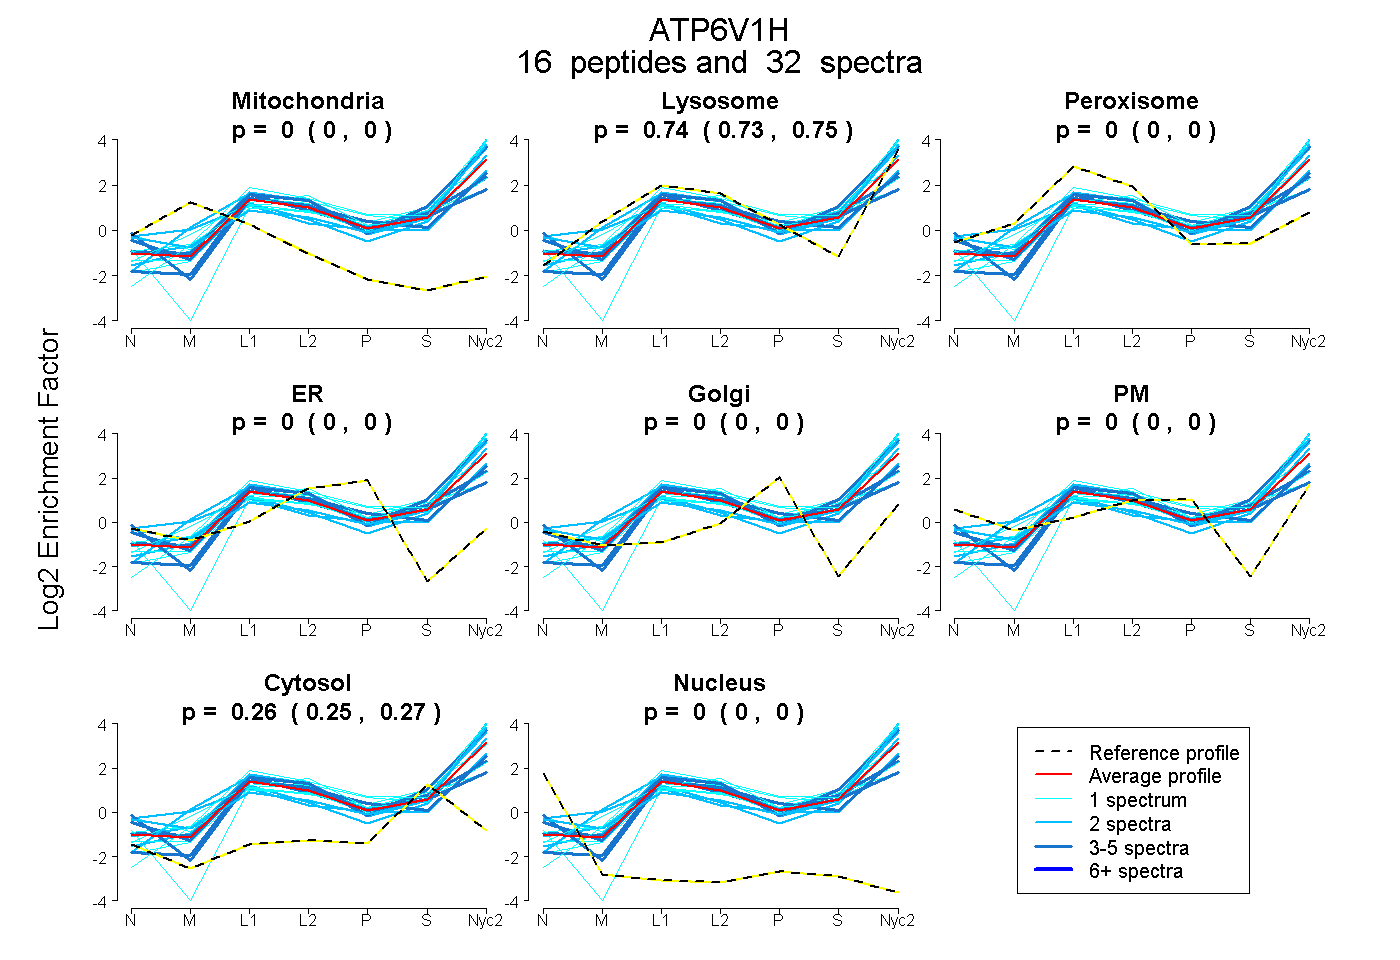
0.000 | 0.000
0.733 | 0.745
0.000 | 0.000
0.000 | 0.000
0.000 | 0.000
0.000 | 0.000
0.253 | 0.266
0.000 | 0.000
5peptides
spectra
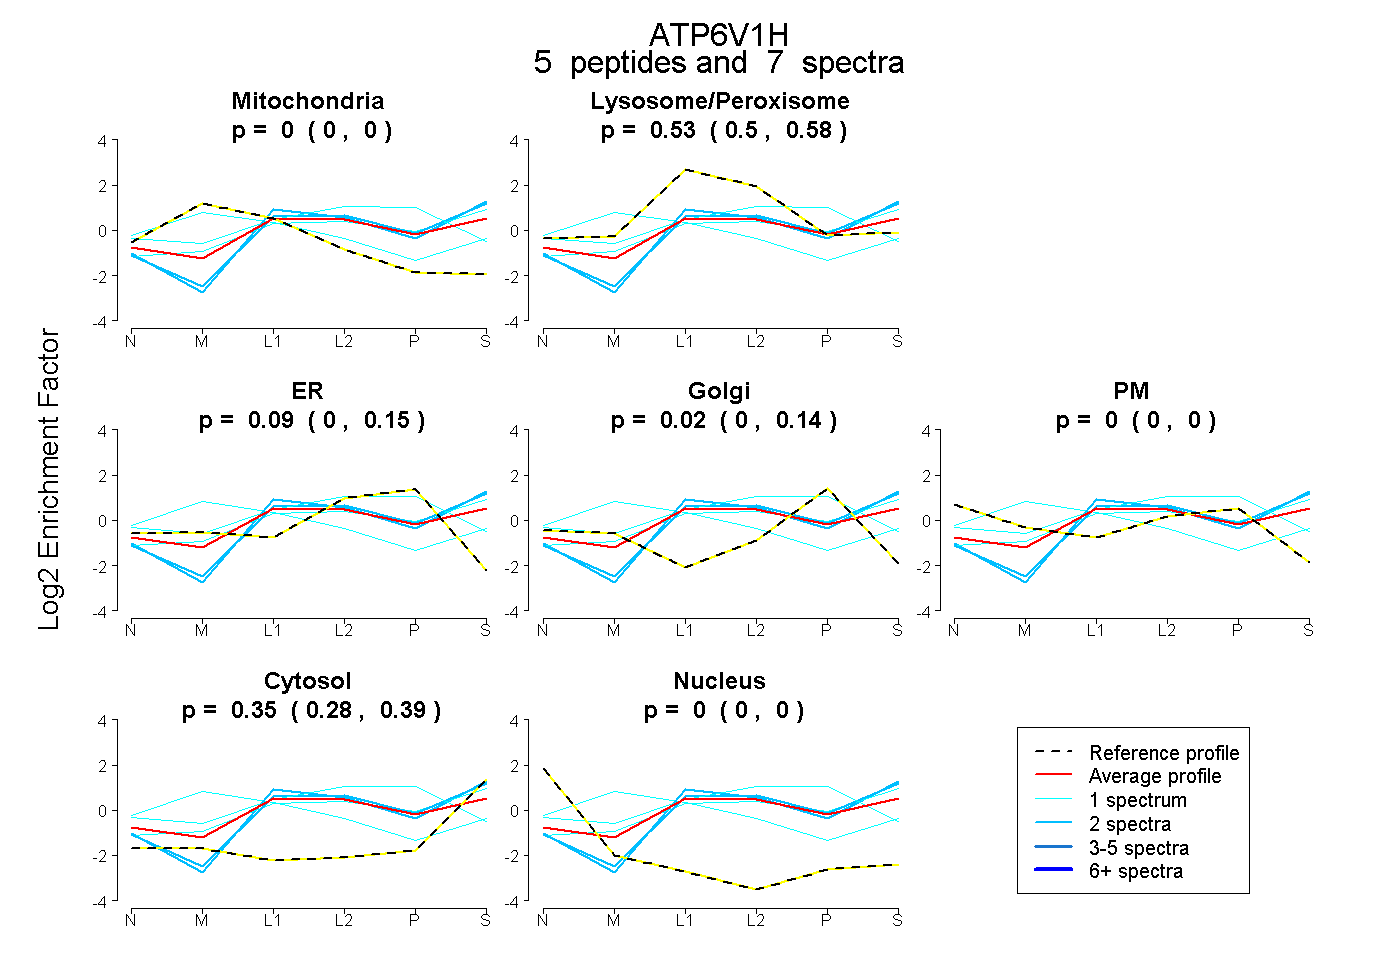
0.000 | 0.000
0.497 | 0.576
0.000 | 0.145
0.000 | 0.142
0.000 | 0.000
0.284 | 0.385
0.000 | 0.000
13peptides
spectra
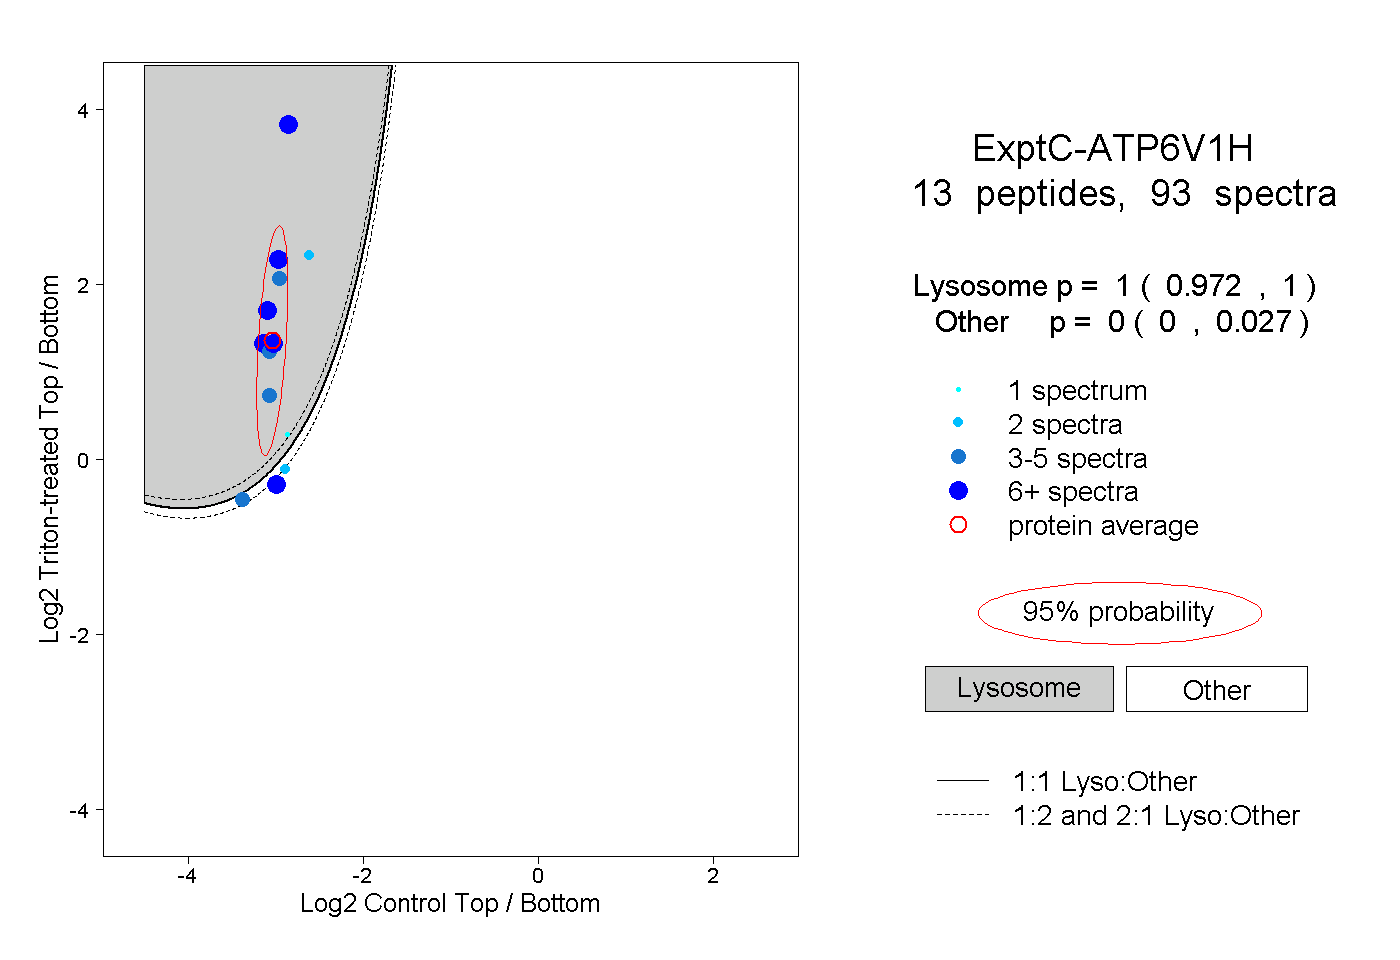
0.972 | 1.000
0.000 | 0.027
3peptides
spectra
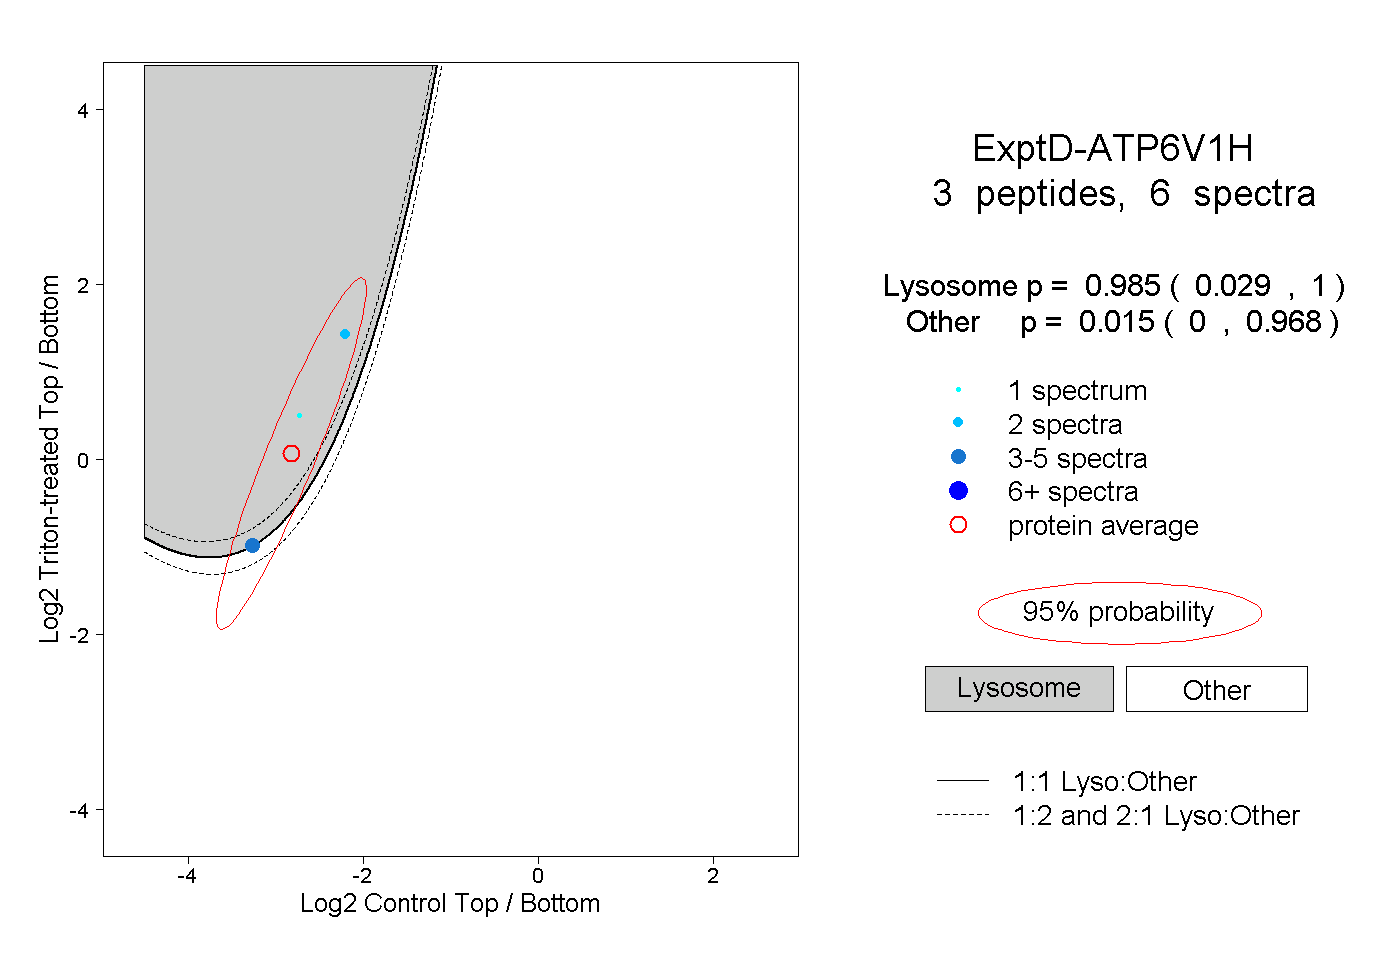
0.029 | 1.000
0.000 | 0.968