 2
2peptides
spectra
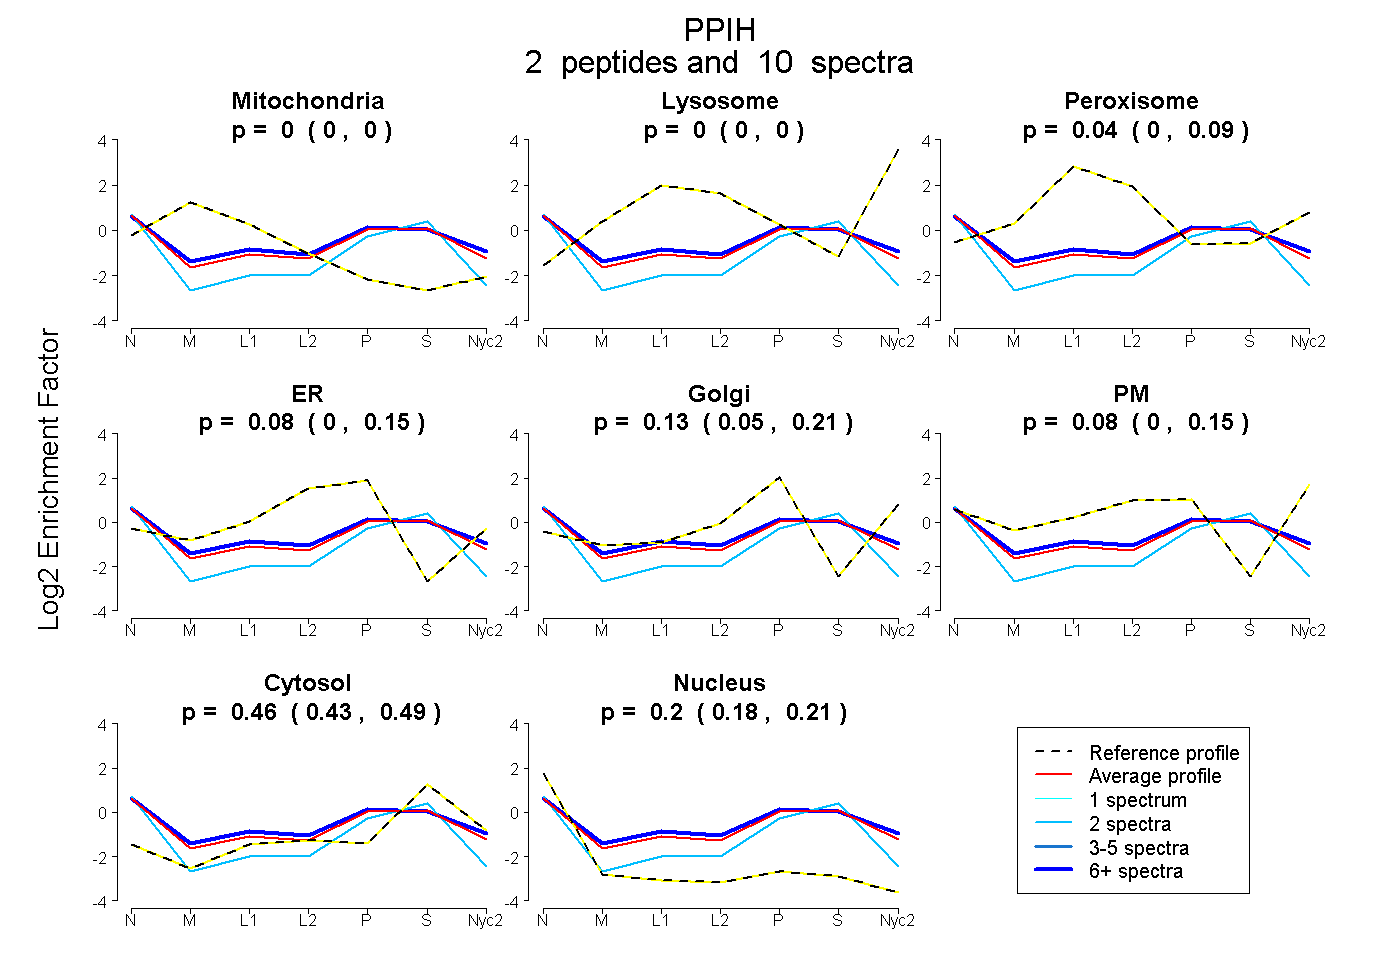
0.000 | 0.000
0.000 | 0.000
0.000 | 0.092
0.004 | 0.146
0.046 | 0.213
0.000 | 0.146
0.425 | 0.494
0.183 | 0.214
1peptide
spectra
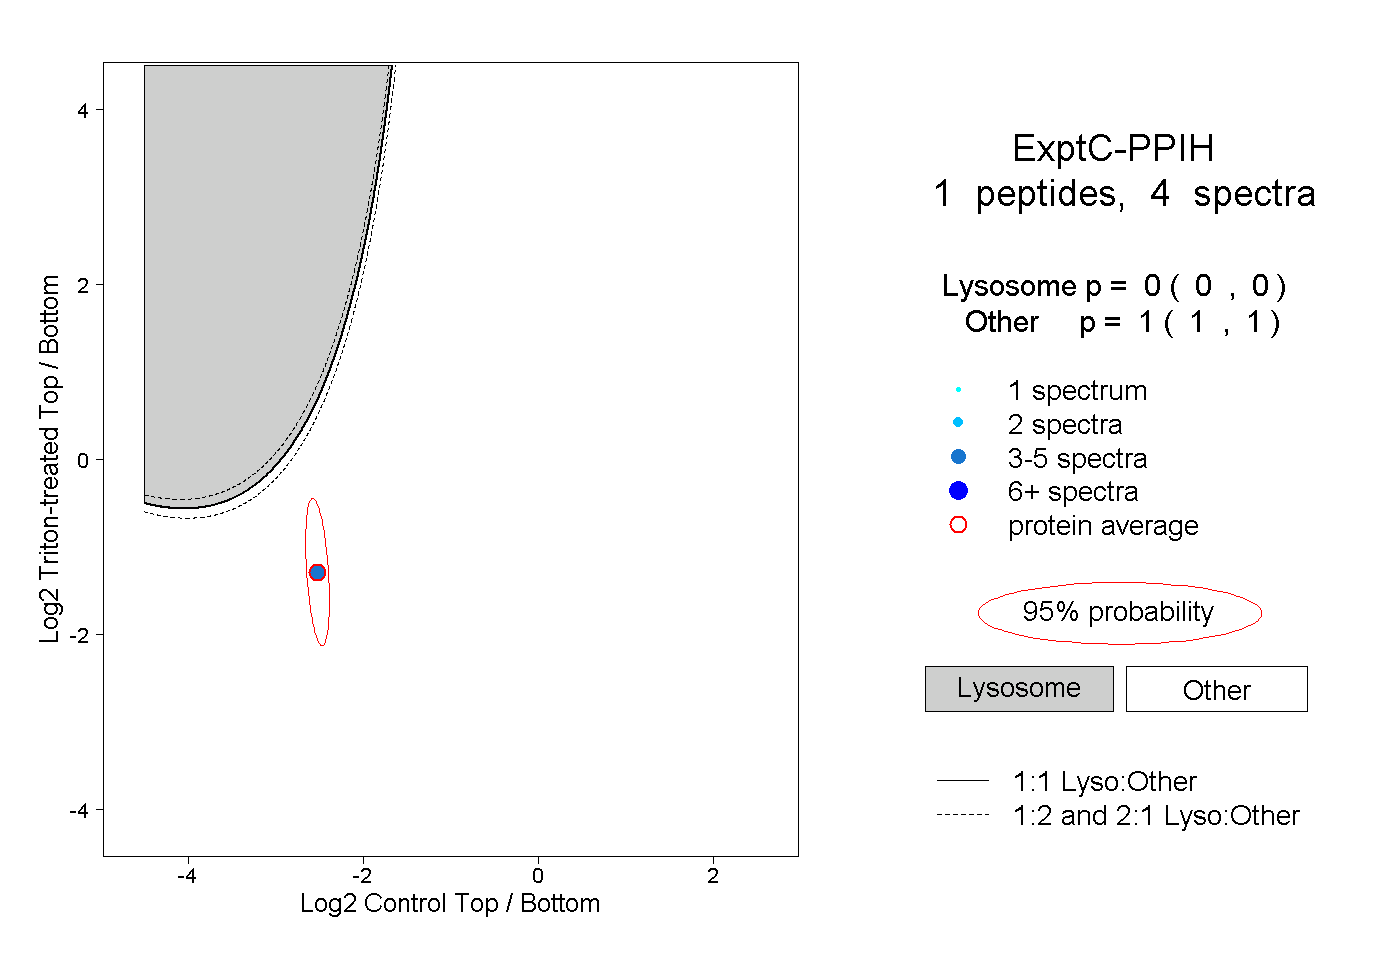
0.000 | 0.000
1.000 | 1.000
| Plot | Mito | Lyso | Perox | ER | Golgi | PM | Cytosol | Nucleus | |||||
| Expt A |
2 peptides |
10 spectra |
|
0.000 0.000 | 0.000 |
0.000 0.000 | 0.000 |
0.042 0.000 | 0.092 |
0.080 0.004 | 0.146 |
0.133 0.046 | 0.213 |
0.082 0.000 | 0.146 |
0.465 0.425 | 0.494 |
0.199 0.183 | 0.214 |
||
| Plot | Lyso | Other | |||||||||||
| Expt C |
1 peptide |
4 spectra |
|
0.000 0.000 | 0.000 |
1.000 1.000 | 1.000 |