ARHGEF1
[ENSRNOP00000059325]
Main page
| | | Plot |
Mito |
Lyso |
|
Perox |
ER |
Golgi |
PM |
Cytosol |
Nucleus |
|
| Expt A |
 14
14
peptides |
41
spectra |
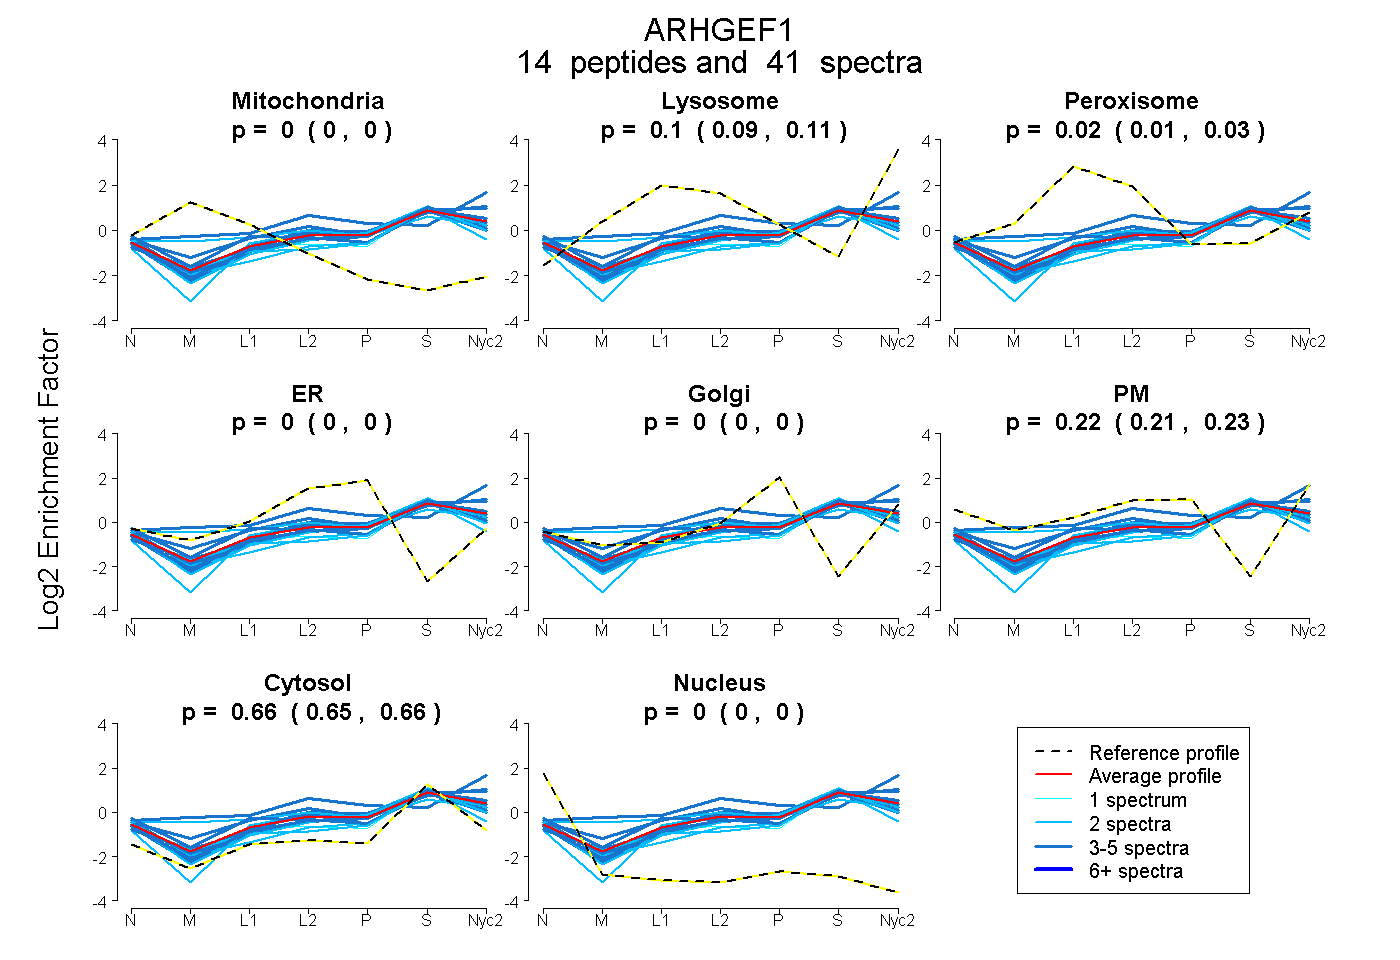 |
0.000
0.000 | 0.000 |
0.101
0.086 | 0.112 |
|
0.019
0.007 | 0.030 |
0.000
0.000 | 0.000 |
0.000
0.000 | 0.000 |
0.221
0.215 | 0.226 |
0.658
0.653 | 0.662 |
0.000
0.000 | 0.000 |
|
| | | Plot |
Mito |
|
Lyso or Perox |
|
ER |
Golgi |
PM |
Cytosol |
Nucleus |
|
| Expt B |
2
peptides |
3
spectra |
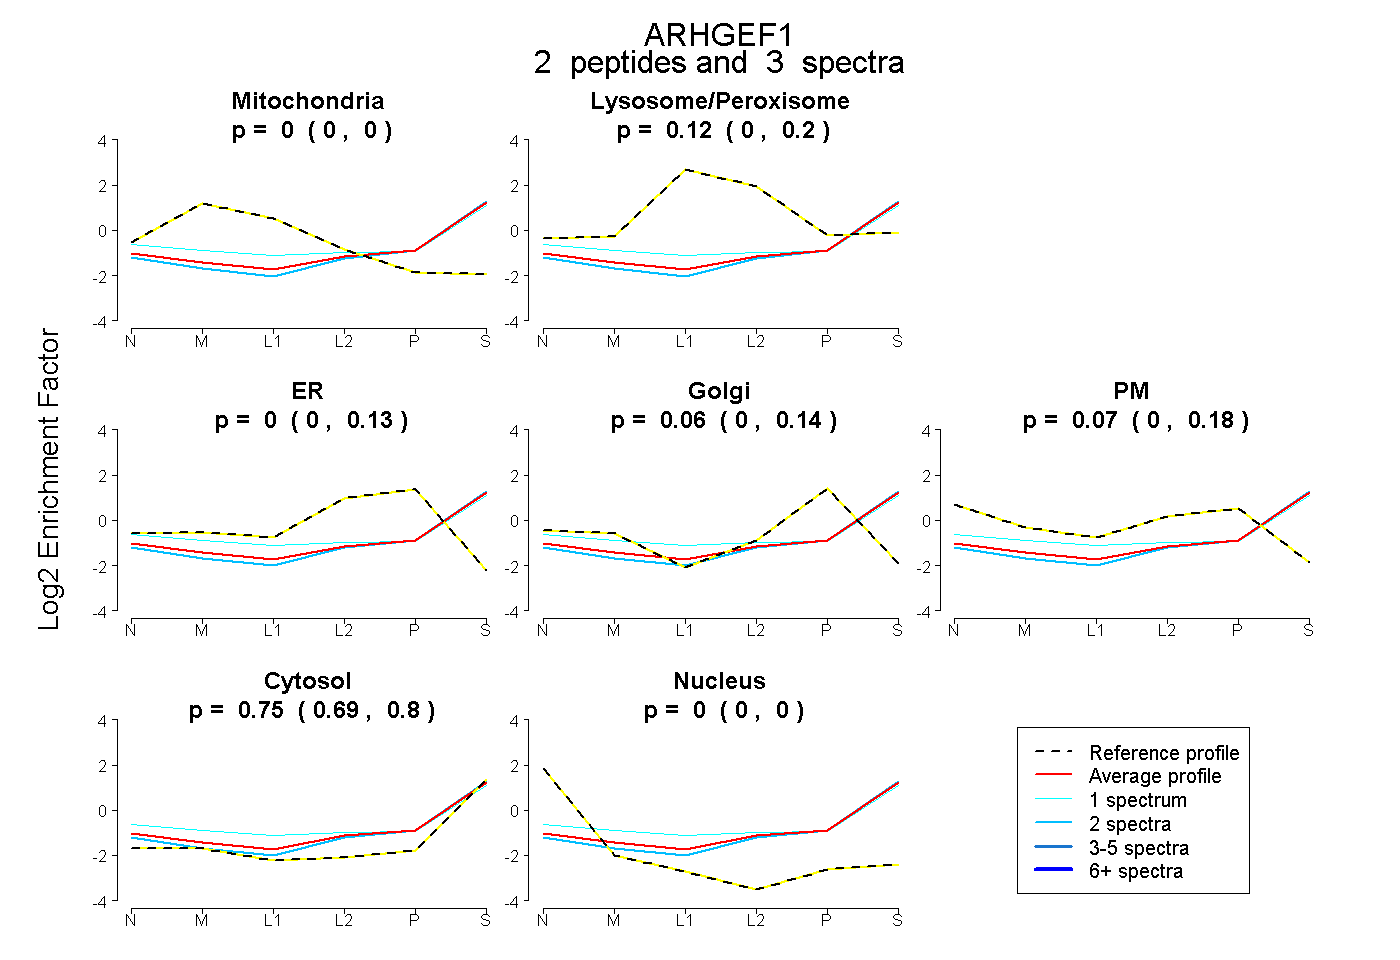 |
0.000
0.000 | 0.000 |
|
0.121
0.002 | 0.200 |
|
0.000
0.000 | 0.134 |
0.061
0.000 | 0.136 |
0.072
0.000 | 0.179 |
0.746
0.690 | 0.801 |
0.000
0.000 | 0.000 |
|
| 2 spectra, TMLRPVLR |
0.000 |
|
0.039 |
|
0.143 |
0.000 |
0.000 |
0.817 |
0.000 |
|
| 1 spectrum, LTSAMTR |
0.000 |
|
0.199 |
|
0.000 |
0.000 |
0.152 |
0.649 |
0.000 |
|
| | | Plot |
|
Lyso |
|
|
|
|
|
|
|
Other |
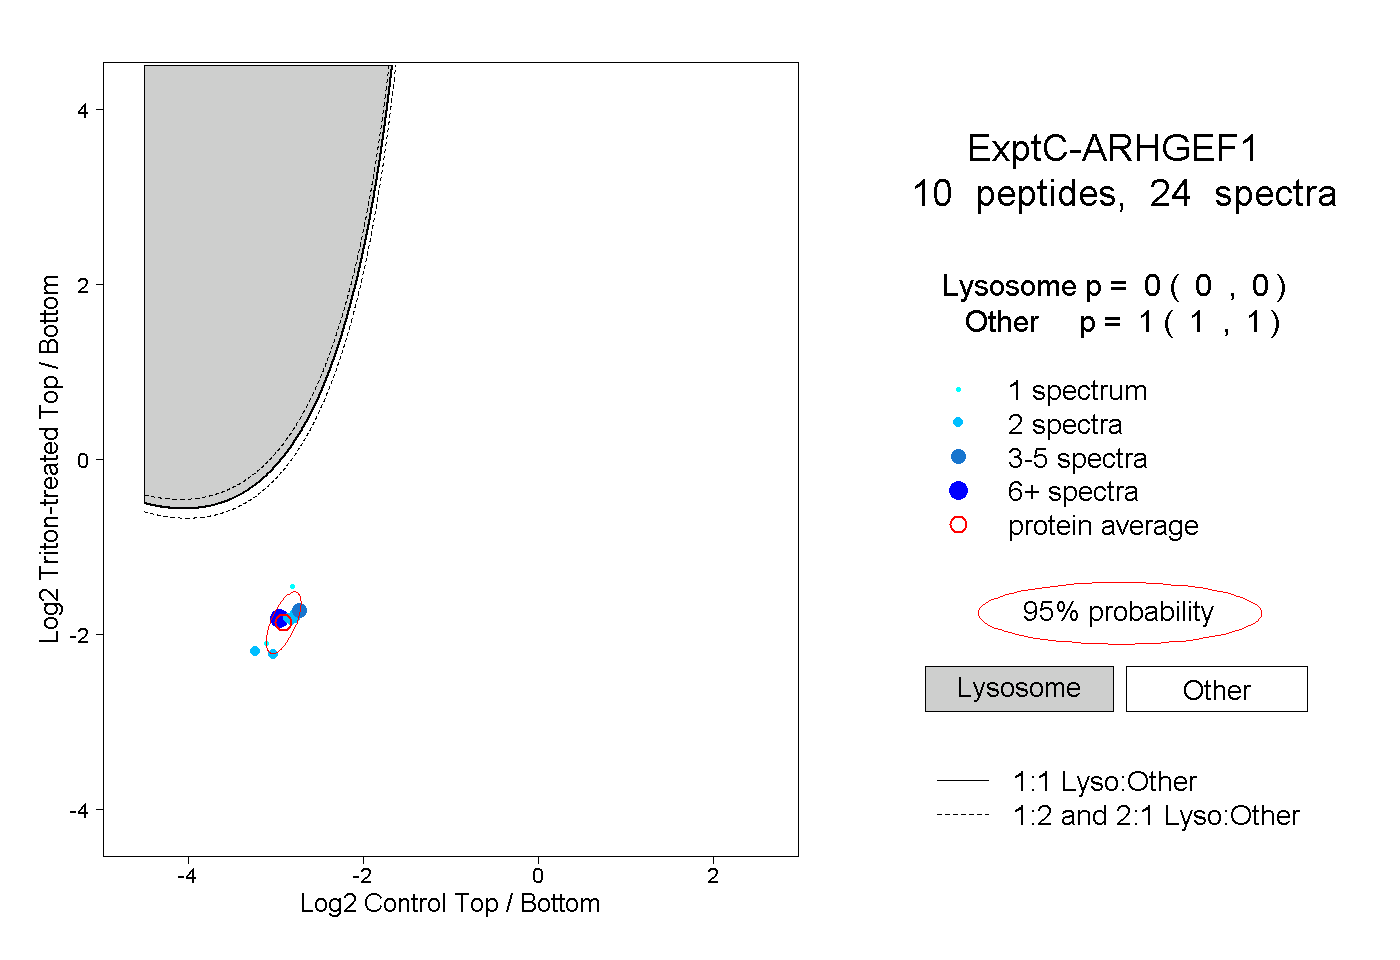
| Expt C |
10
peptides |
24
spectra |
 |
|
0.000
0.000 | 0.000 |
|
|
|
|
|
|
|
1.000
1.000 | 1.000 |
| | | Plot |
|
Lyso |
|
|
|
|
|
|
|
Other |
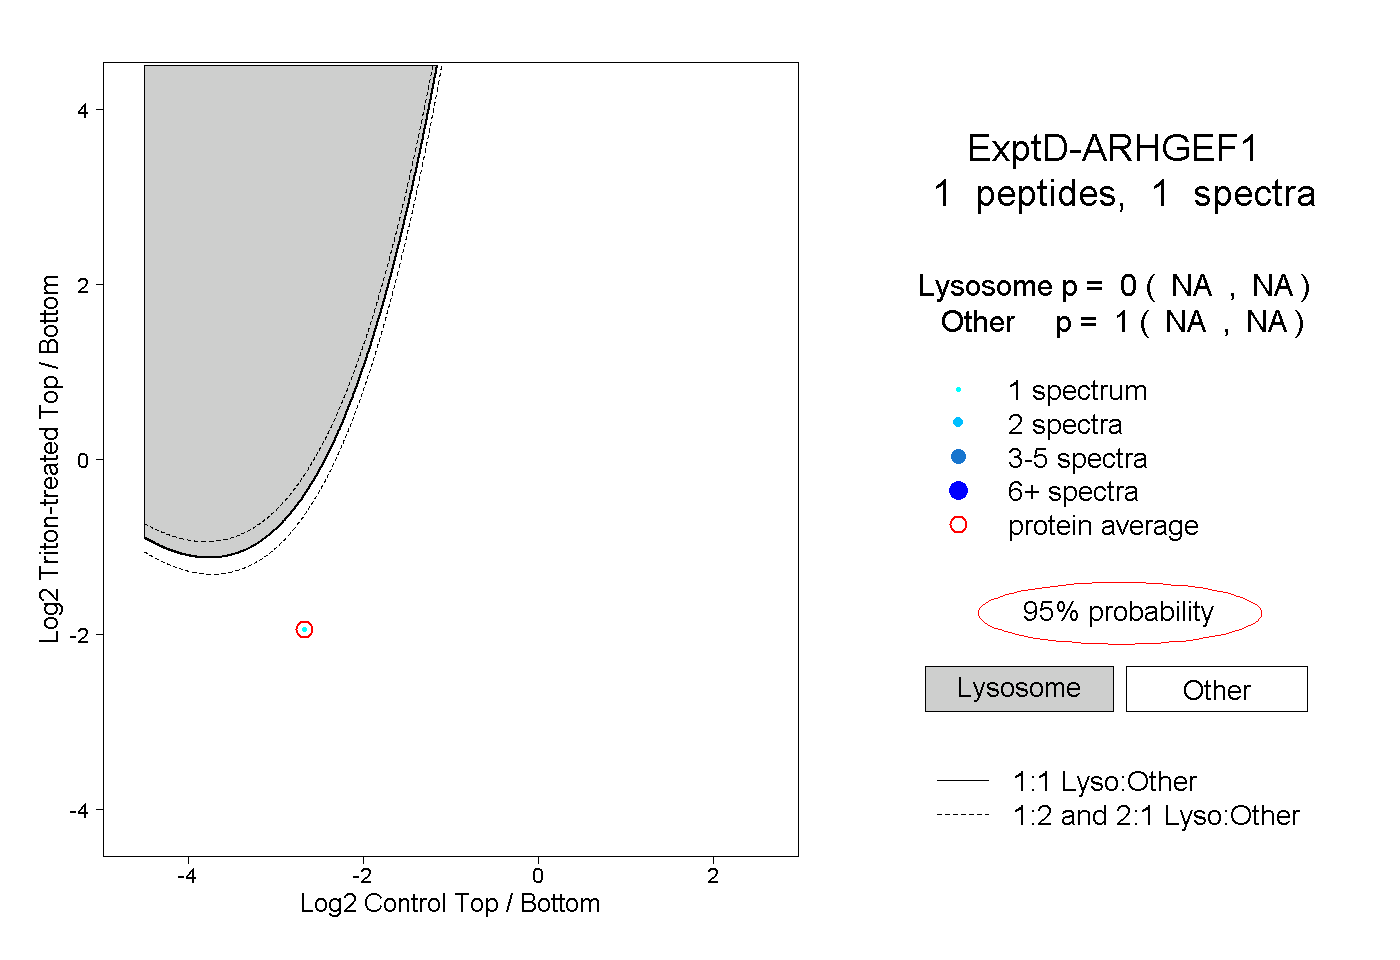
| Expt D |
1
peptide |
1
spectrum |
 |
|
0.000
NA | NA |
|
|
|
|
|
|
|
1.000
NA | NA |