 14
14peptides
spectra
0.000 | 0.000
0.086 | 0.112
0.007 | 0.030
0.000 | 0.000
0.000 | 0.000
0.215 | 0.226
0.653 | 0.662
0.000 | 0.000
| Plot | Mito | Lyso | Perox | ER | Golgi | PM | Cytosol | Nucleus | |||||
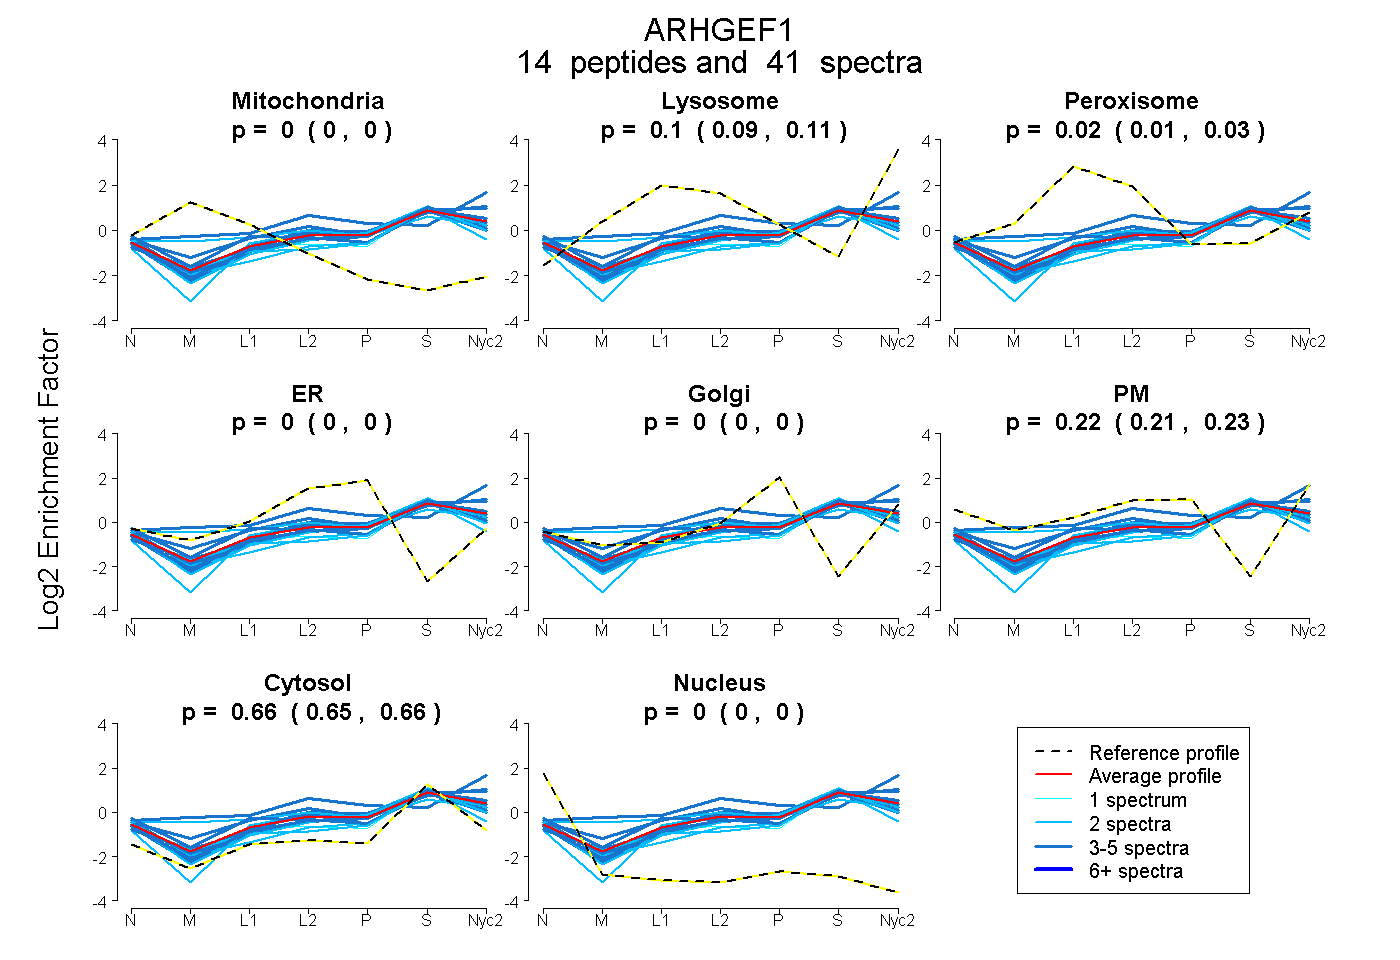
| Expt A |
14 peptides |
41 spectra |
|
0.000 0.000 | 0.000 |
0.101 0.086 | 0.112 |
0.019 0.007 | 0.030 |
0.000 0.000 | 0.000 |
0.000 0.000 | 0.000 |
0.221 0.215 | 0.226 |
0.658 0.653 | 0.662 |
0.000 0.000 | 0.000 |
| 3 spectra, LDLTHLR | 0.000 | 0.254 | 0.022 | 0.000 | 0.000 | 0.182 | 0.542 | 0.000 | ||
| 2 spectra, TLTPTPDGK | 0.000 | 0.009 | 0.000 | 0.000 | 0.021 | 0.251 | 0.719 | 0.000 | ||
| 5 spectra, LTSAMTR | 0.000 | 0.180 | 0.000 | 0.000 | 0.000 | 0.195 | 0.624 | 0.000 | ||
| 2 spectra, FCAFVQEAESRPR | 0.000 | 0.000 | 0.000 | 0.000 | 0.000 | 0.210 | 0.790 | 0.000 | ||
| 3 spectra, EILHHVNQAVR | 0.000 | 0.362 | 0.000 | 0.000 | 0.000 | 0.290 | 0.348 | 0.000 | ||
| 3 spectra, EVATDHK | 0.000 | 0.000 | 0.089 | 0.030 | 0.000 | 0.221 | 0.660 | 0.000 | ||
| 5 spectra, TMLRPVLR | 0.000 | 0.083 | 0.000 | 0.000 | 0.000 | 0.205 | 0.711 | 0.000 | ||
| 2 spectra, SGLEQEPEEPPGWR | 0.000 | 0.026 | 0.022 | 0.000 | 0.000 | 0.193 | 0.759 | 0.000 | ||
| 3 spectra, QLEDFR | 0.000 | 0.000 | 0.194 | 0.000 | 0.000 | 0.178 | 0.627 | 0.000 | ||
| 2 spectra, QILLSTEEDSGAGPPR | 0.000 | 0.007 | 0.249 | 0.000 | 0.008 | 0.226 | 0.509 | 0.000 | ||
| 4 spectra, DMEDLLR | 0.000 | 0.057 | 0.000 | 0.000 | 0.000 | 0.209 | 0.734 | 0.000 | ||
| 1 spectrum, AFLDFYHSFLEK | 0.000 | 0.054 | 0.055 | 0.000 | 0.000 | 0.113 | 0.778 | 0.000 | ||
| 4 spectra, LVHEGPLTWR | 0.000 | 0.162 | 0.000 | 0.000 | 0.019 | 0.175 | 0.644 | 0.000 | ||
| 2 spectra, GEPSAPDCR | 0.000 | 0.101 | 0.000 | 0.156 | 0.000 | 0.000 | 0.743 | 0.000 |
| Plot | Mito | Lyso or Perox | ER | Golgi | PM | Cytosol | Nucleus | ||||||
| Expt B |
2 peptides |
3 spectra |
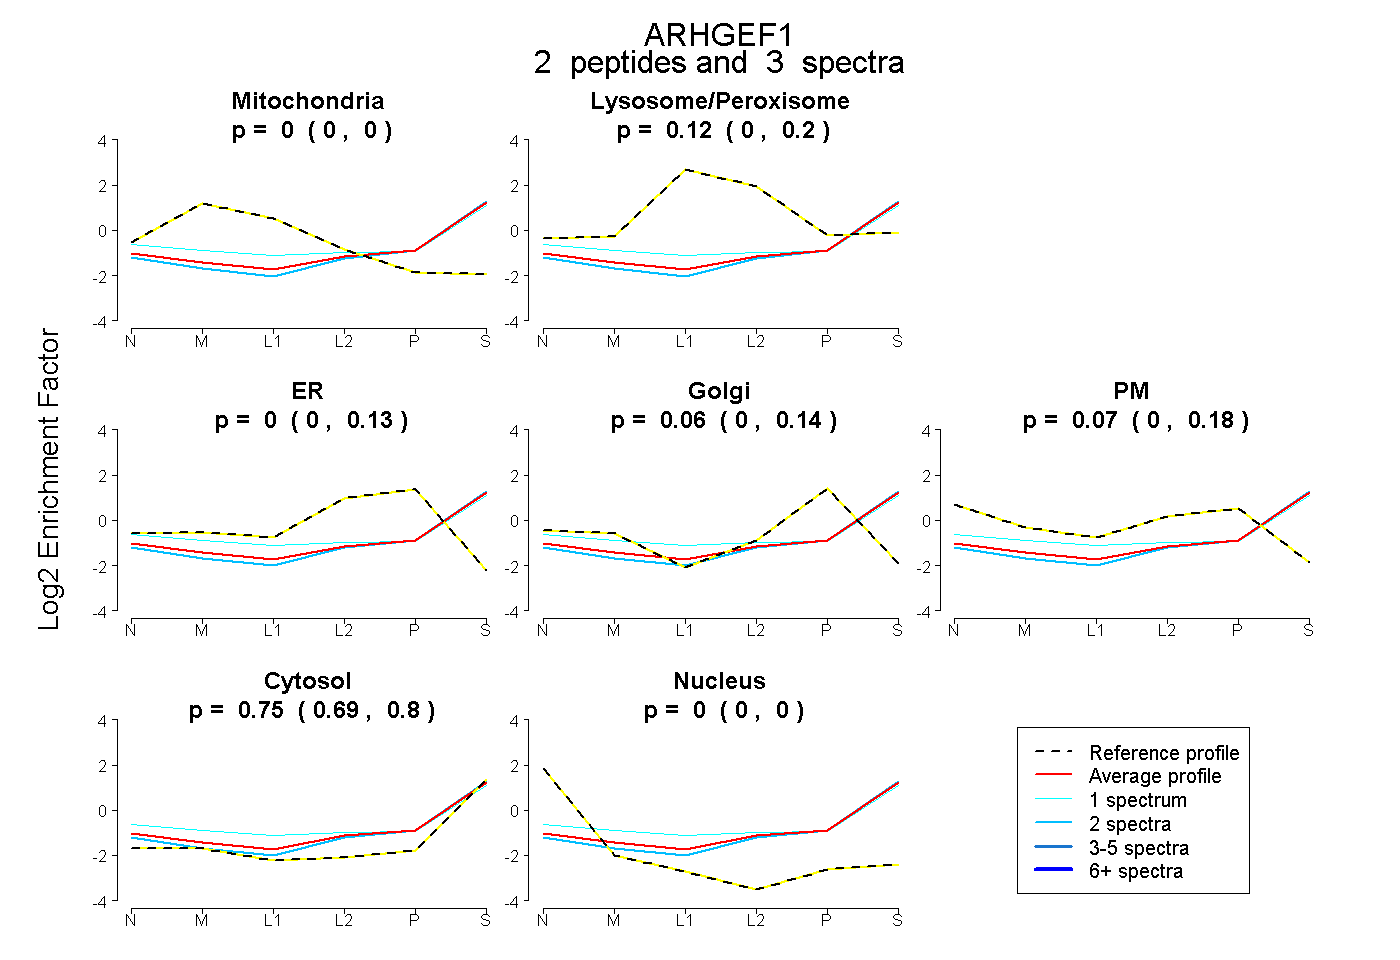 |
0.000 0.000 | 0.000 |
0.121 0.002 | 0.200 |
0.000 0.000 | 0.134 |
0.061 0.000 | 0.136 |
0.072 0.000 | 0.179 |
0.746 0.690 | 0.801 |
0.000 0.000 | 0.000 |
|||
| Plot | Lyso | Other | |||||||||||
| Expt C |
10 peptides |
24 spectra |
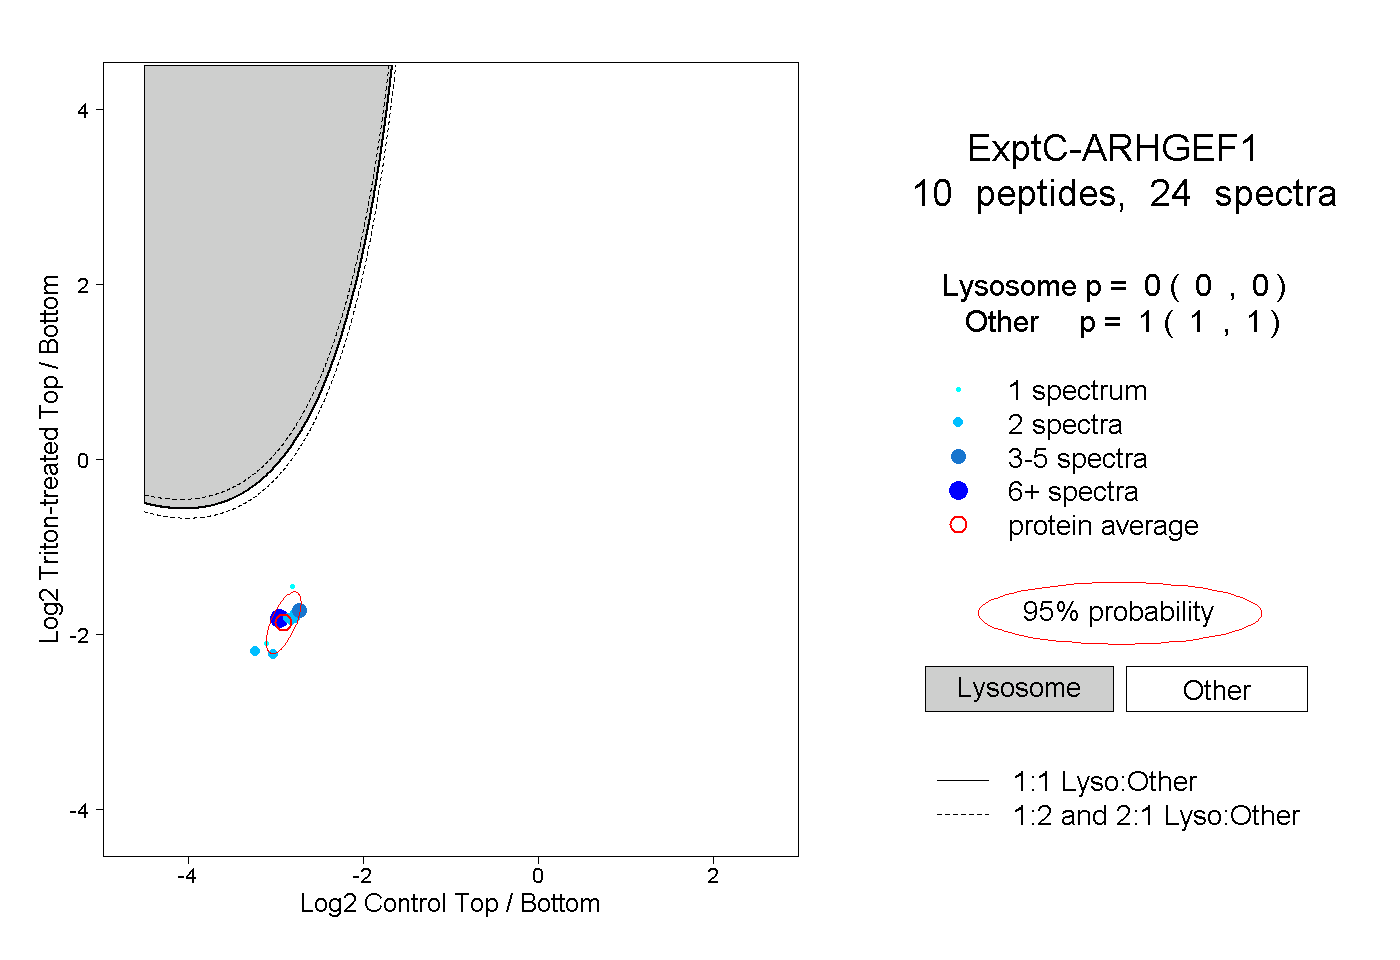 |
0.000 0.000 | 0.000 |
1.000 1.000 | 1.000 |
||||||||
| Plot | Lyso | Other | |||||||||||
| Expt D |
1 peptide |
1 spectrum |
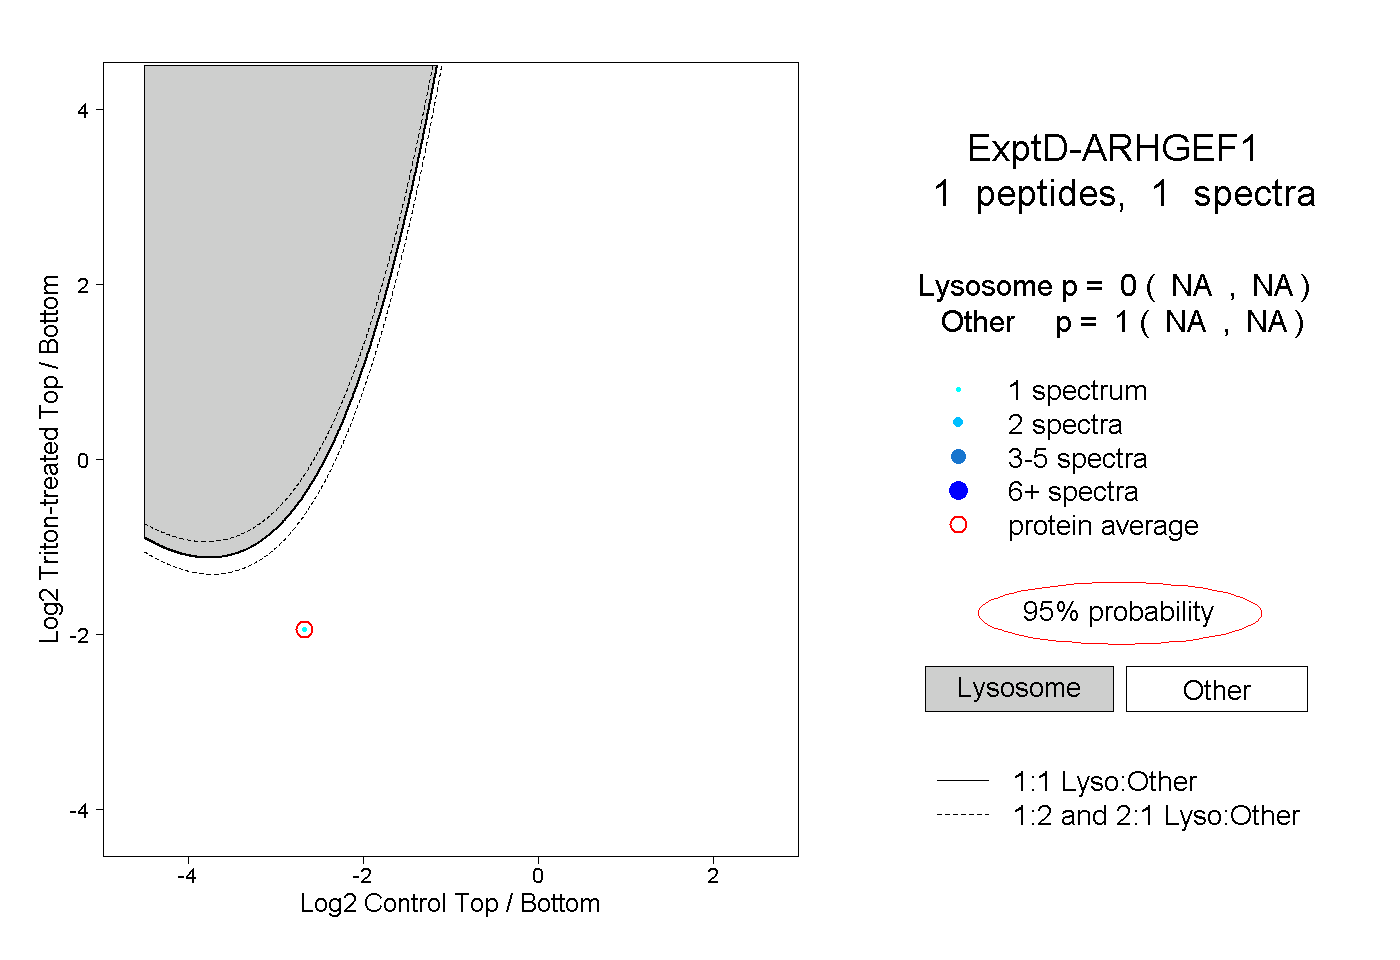 |
0.000 NA | NA |
1.000 NA | NA |