 14
14peptides
spectra
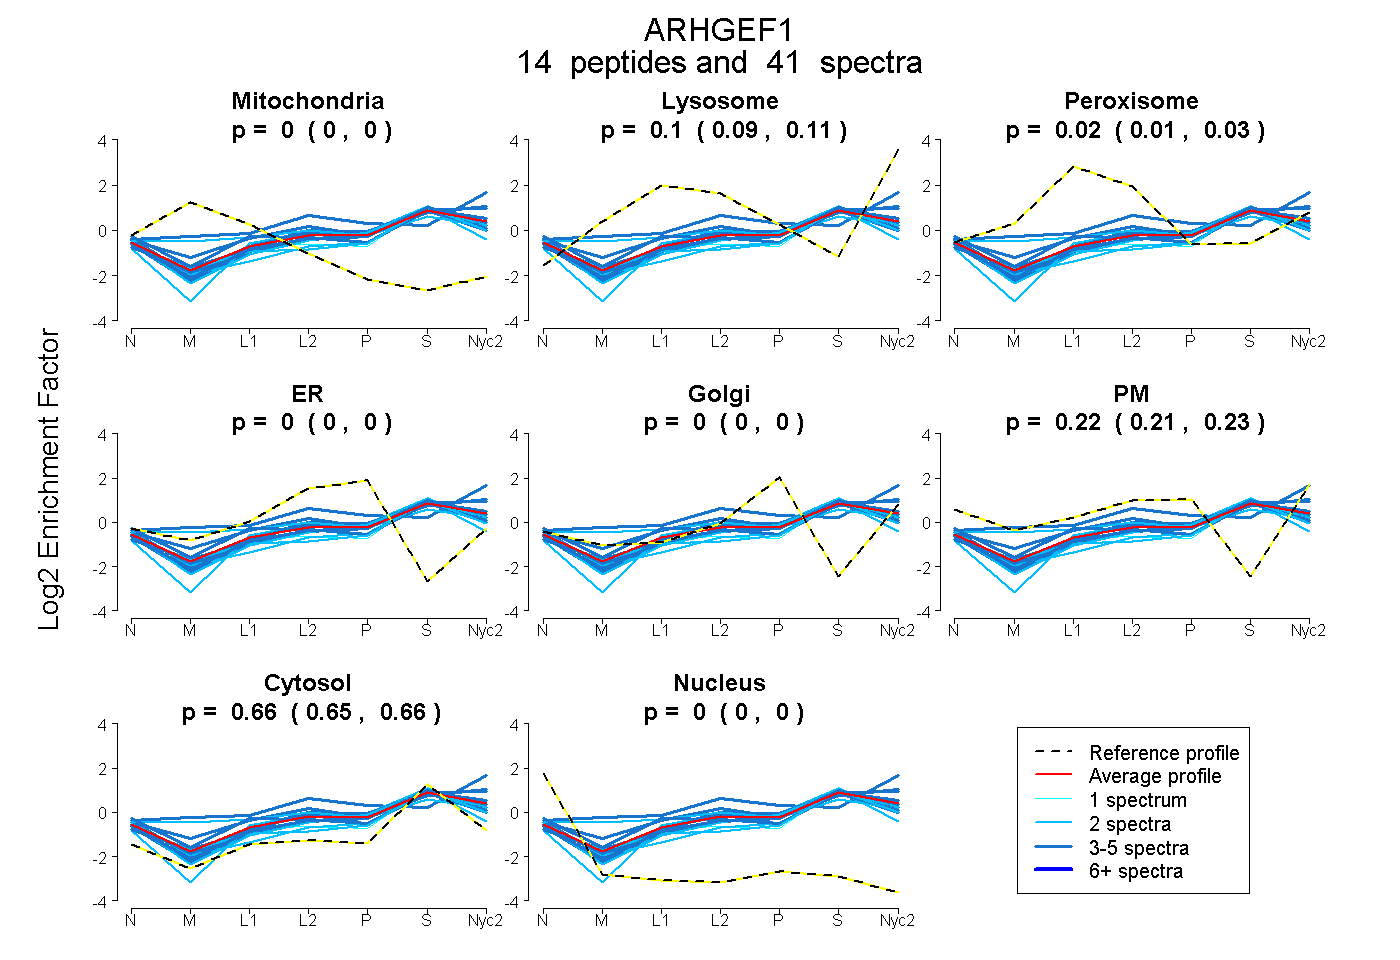
0.000 | 0.000
0.086 | 0.112
0.007 | 0.030
0.000 | 0.000
0.000 | 0.000
0.215 | 0.226
0.653 | 0.662
0.000 | 0.000
2peptides
spectra
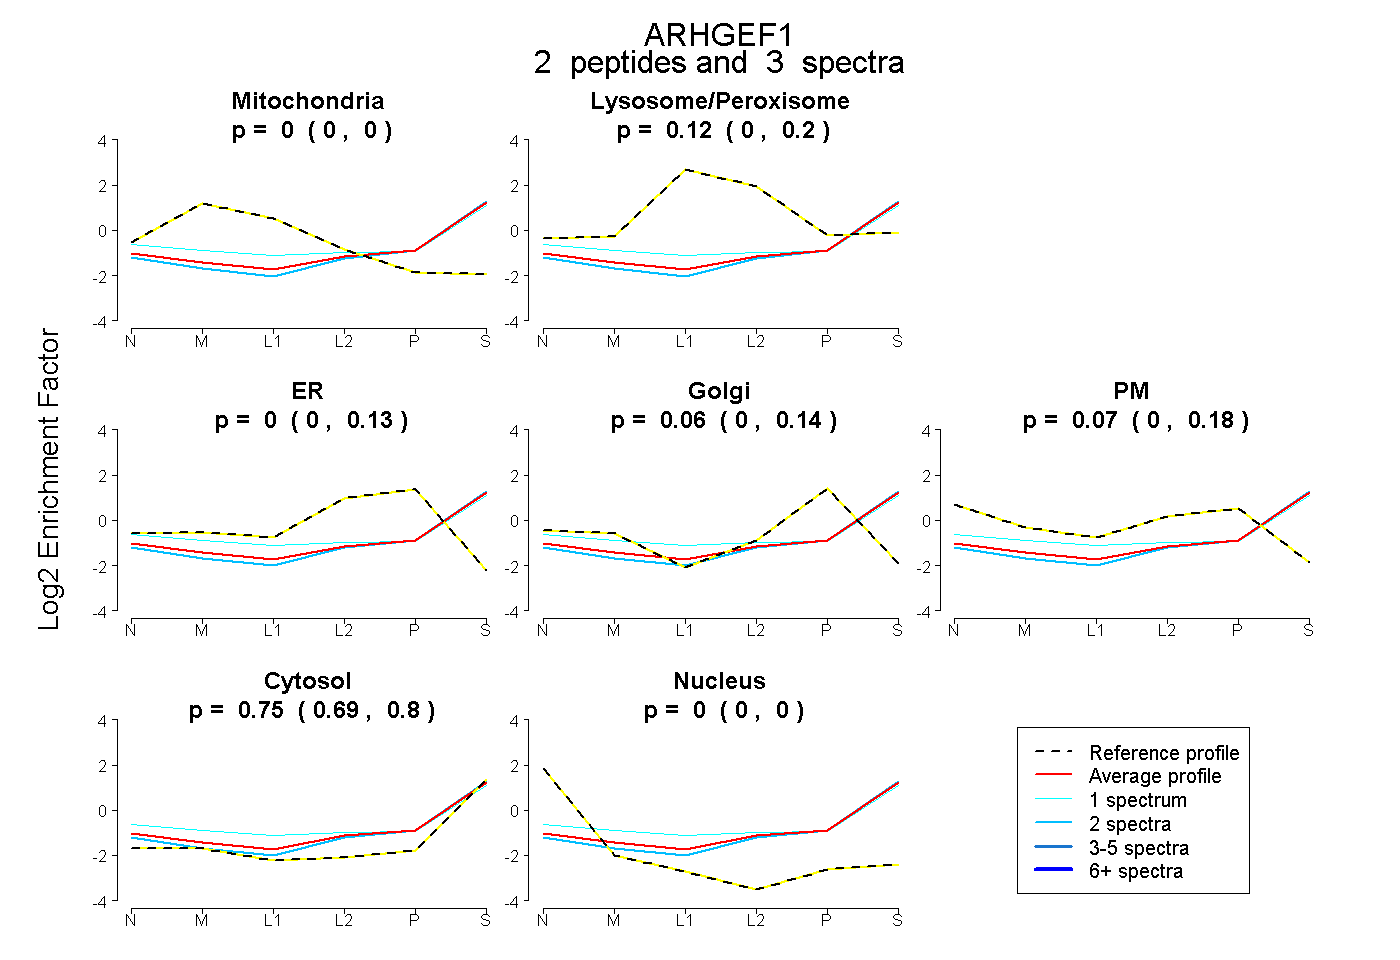
0.000 | 0.000
0.002 | 0.200
0.000 | 0.134
0.000 | 0.136
0.000 | 0.179
0.690 | 0.801
0.000 | 0.000
10peptides
spectra
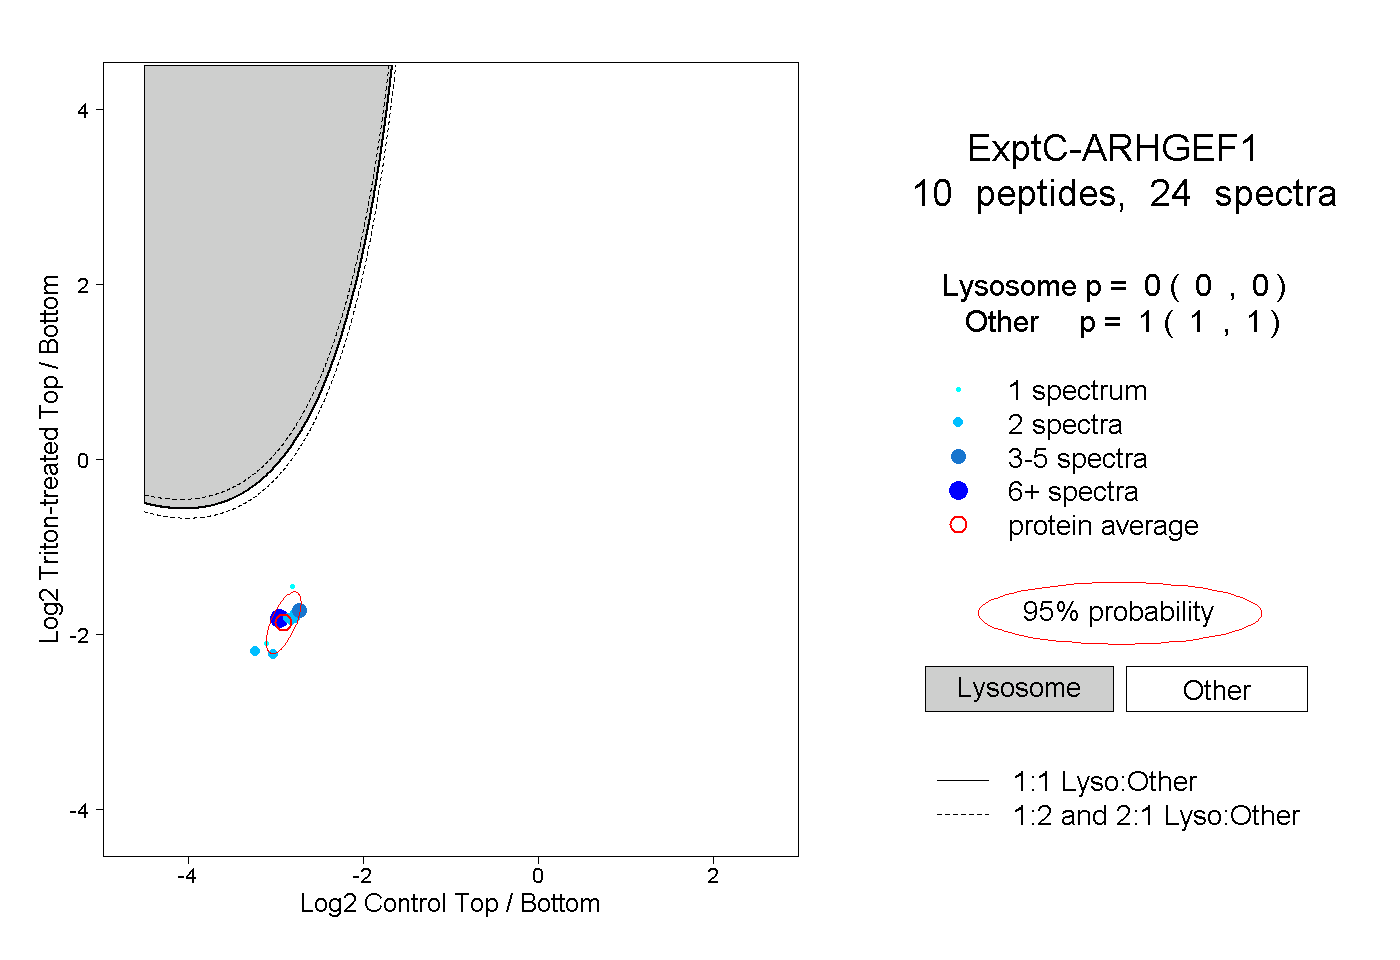
0.000 | 0.000
1.000 | 1.000
1peptide
spectrum
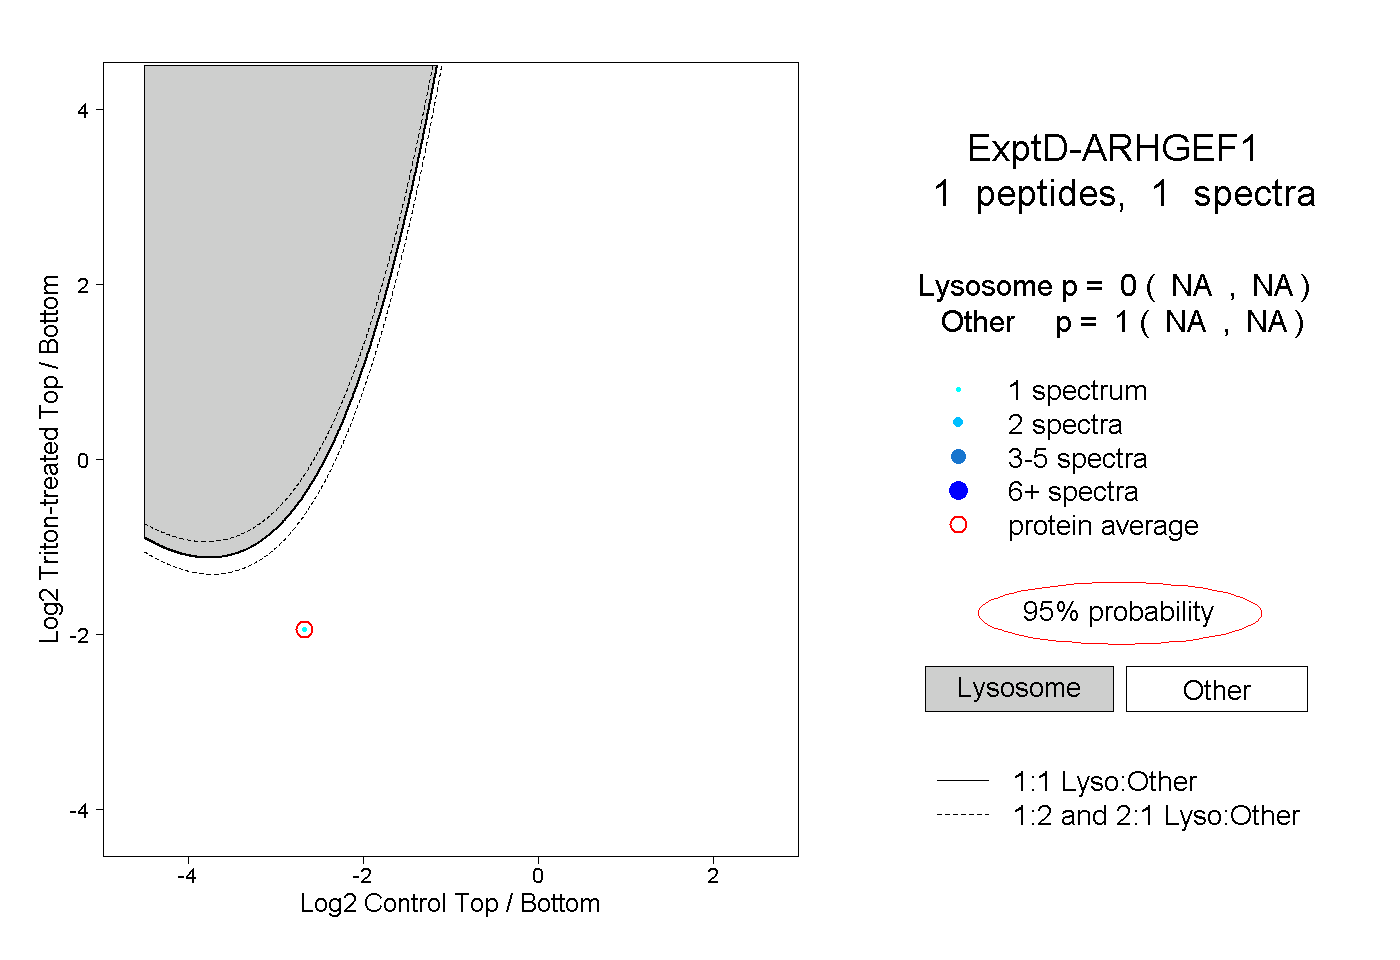
NA | NA
NA | NA