 3
3peptides
spectra
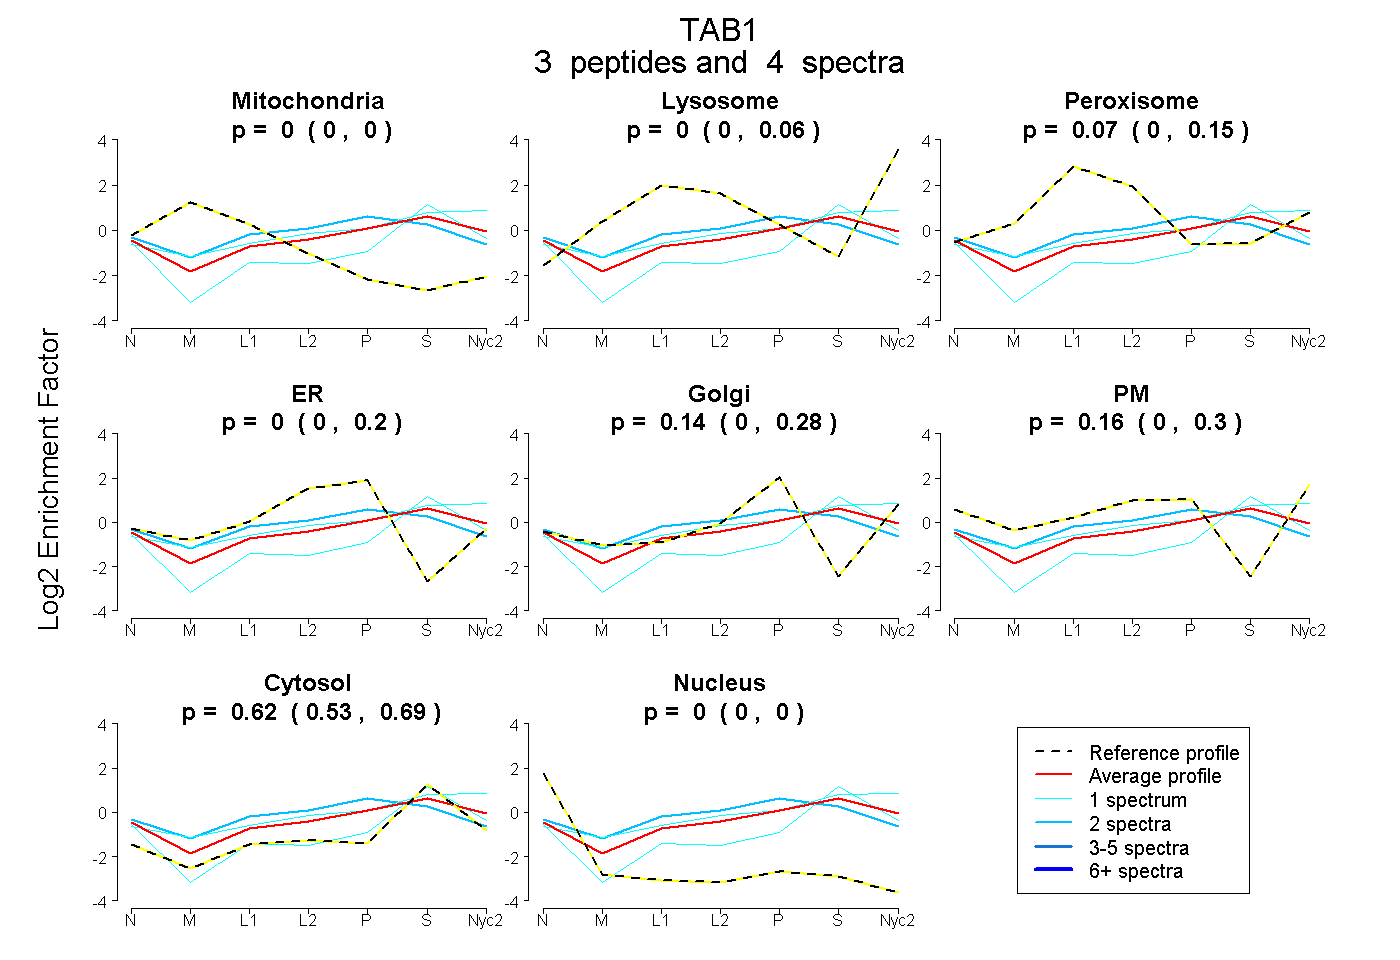
0.000 | 0.000
0.000 | 0.062
0.000 | 0.147
0.000 | 0.204
0.000 | 0.281
0.000 | 0.300
0.534 | 0.693
0.000 | 0.000
| Plot | Mito | Lyso | Perox | ER | Golgi | PM | Cytosol | Nucleus | |||||
| Expt A |
3 peptides |
4 spectra |
|
0.000 0.000 | 0.000 |
0.000 0.000 | 0.062 |
0.072 0.000 | 0.147 |
0.000 0.000 | 0.204 |
0.142 0.000 | 0.281 |
0.164 0.000 | 0.300 |
0.621 0.534 | 0.693 |
0.000 0.000 | 0.000 |
| 1 spectrum, SFLESIDDALAEK | 0.000 | 0.000 | 0.000 | 0.000 | 0.035 | 0.030 | 0.901 | 0.034 | ||
| 2 spectra, GTESHPPEDNWLK | 0.000 | 0.000 | 0.145 | 0.371 | 0.000 | 0.000 | 0.484 | 0.000 | ||
| 1 spectrum, VTNFVAQR | 0.000 | 0.227 | 0.000 | 0.000 | 0.022 | 0.185 | 0.566 | 0.000 |
| Plot | Lyso | Other | |||||||||||
| Expt C |
1 peptide |
1 spectrum |
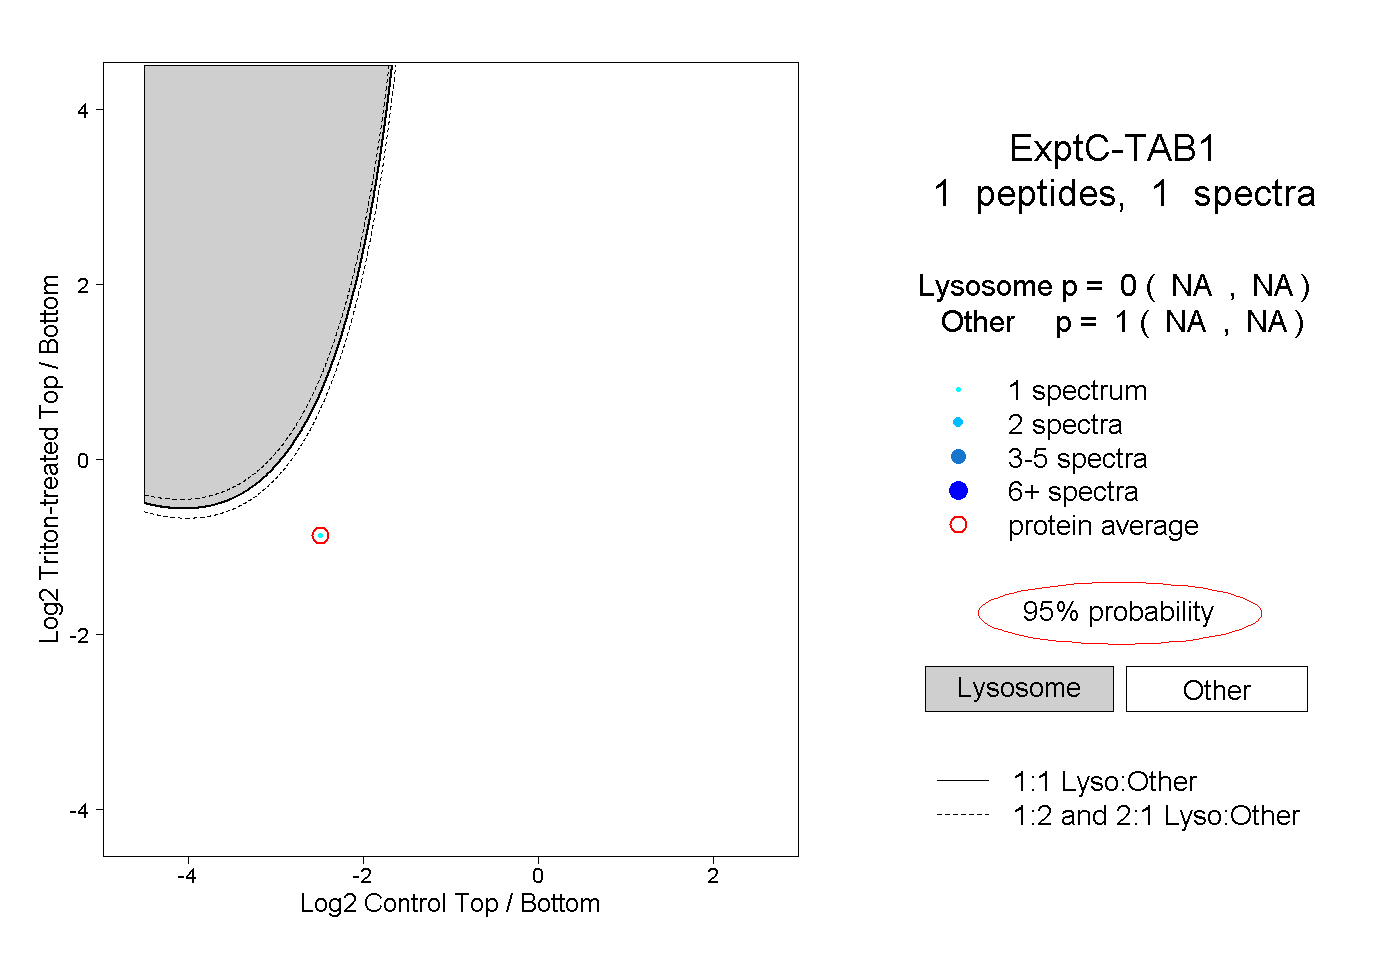 |
0.000 NA | NA |
1.000 NA | NA |