 4
4peptides
spectra
0.000 | 0.065
0.000 | 0.000
0.000 | 0.070
0.346 | 0.508
0.048 | 0.286
0.030 | 0.217
0.142 | 0.271
0.000 | 0.016
2peptides
spectra
0.000 | 0.000
1.000 | 1.000
| Plot | Mito | Lyso | Perox | ER | Golgi | PM | Cytosol | Nucleus | |||||
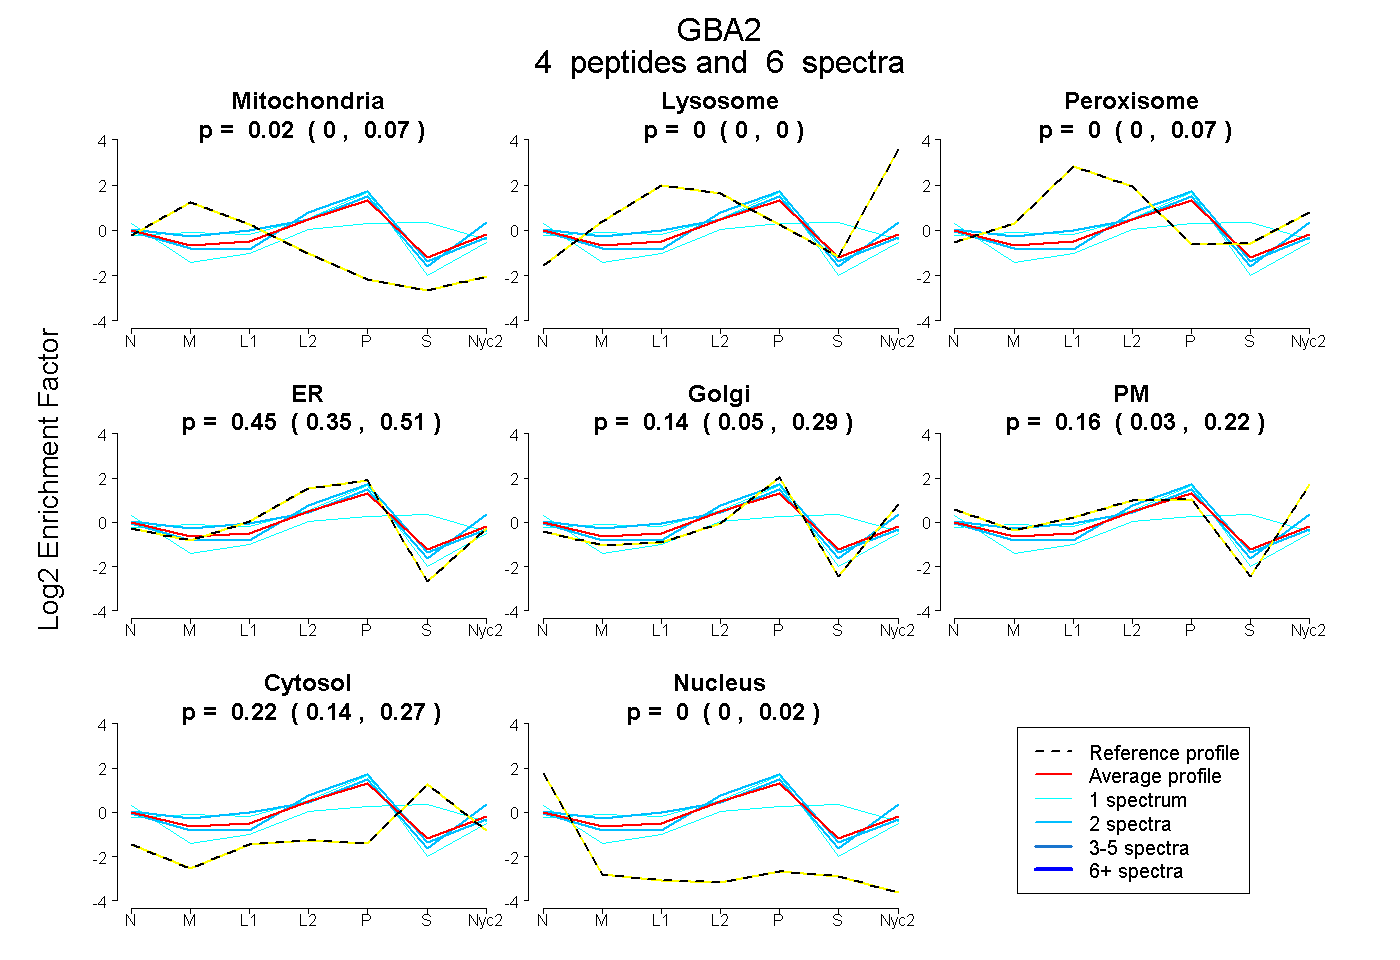
| Expt A |
4 peptides |
6 spectra |
|
0.022 0.000 | 0.065 |
0.000 0.000 | 0.000 |
0.005 0.000 | 0.070 |
0.452 0.346 | 0.508 |
0.143 0.048 | 0.286 |
0.156 0.030 | 0.217 |
0.222 0.142 | 0.271 |
0.000 0.000 | 0.016 |
||
| Plot | Lyso | Other | |||||||||||
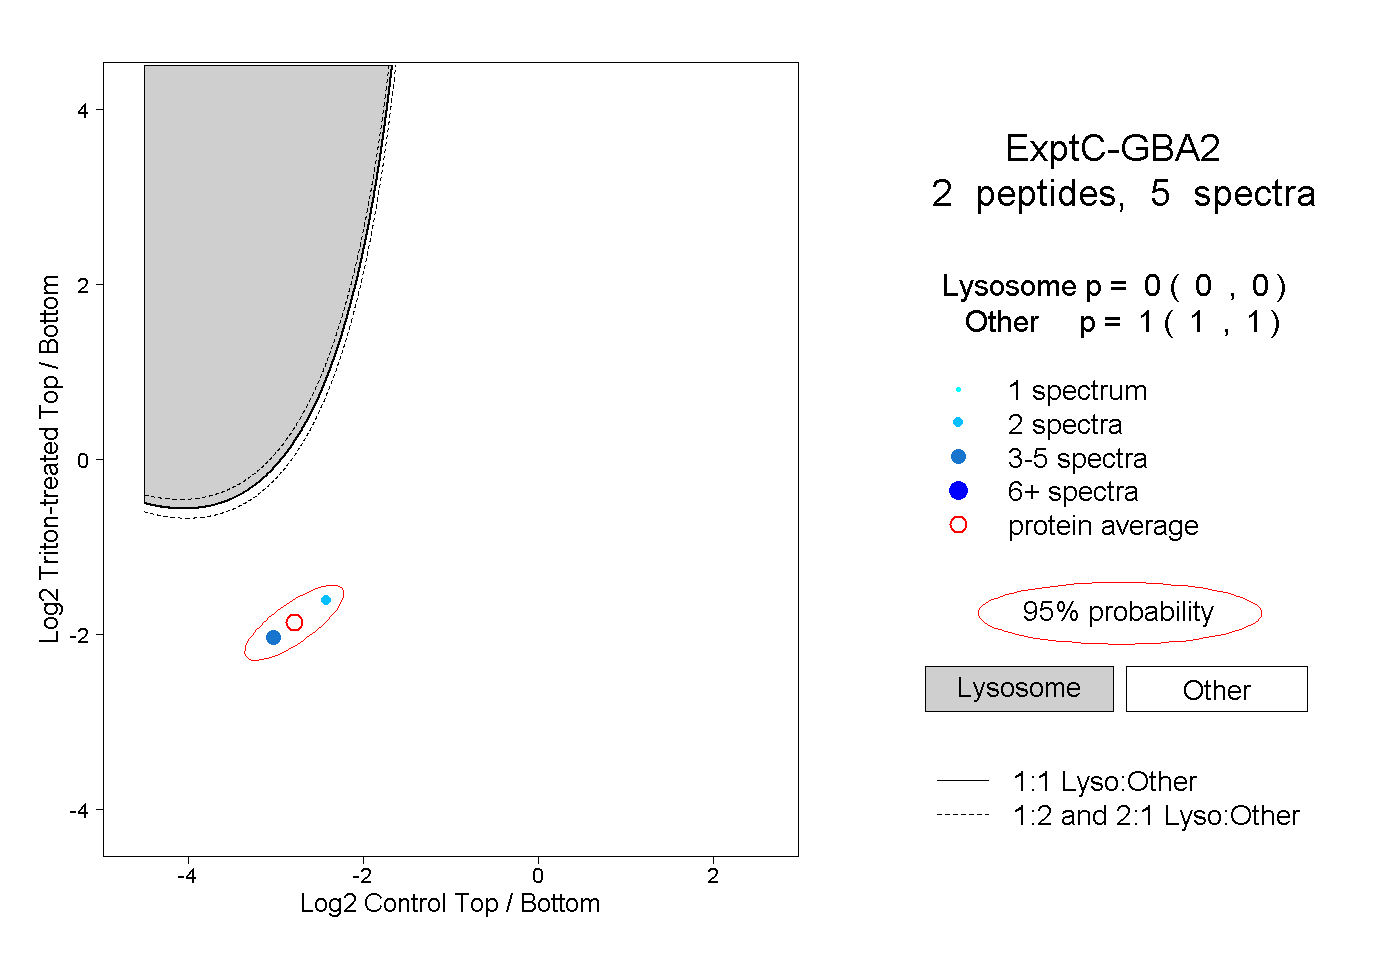
| Expt C |
2 peptides |
5 spectra |
|
0.000 0.000 | 0.000 |
1.000 1.000 | 1.000 |