 4
4peptides
spectra
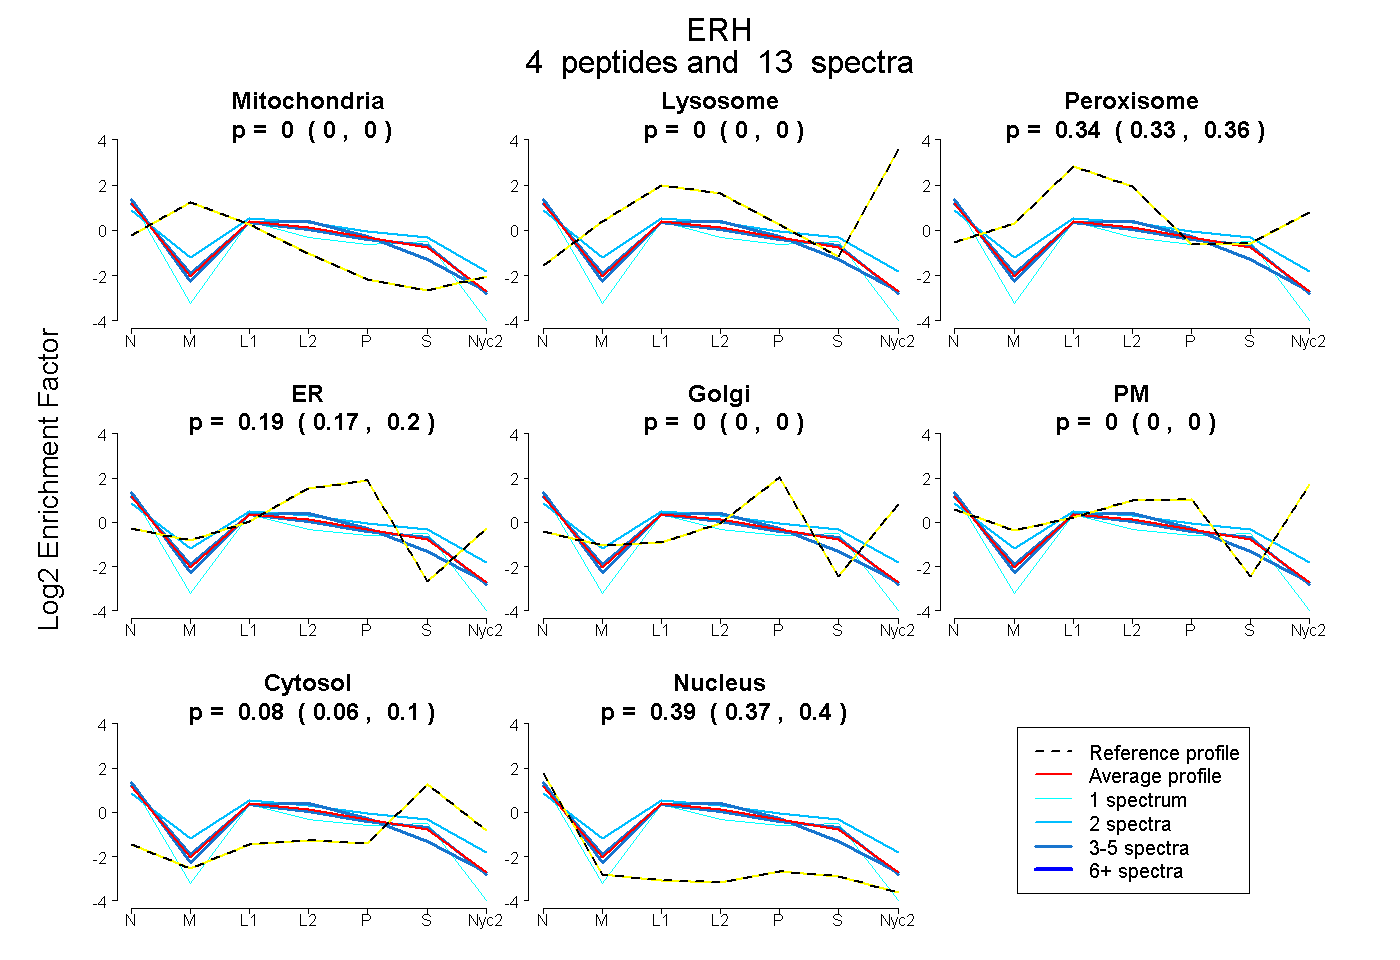
0.000 | 0.000
0.000 | 0.000
0.325 | 0.356
0.169 | 0.201
0.000 | 0.000
0.000 | 0.000
0.055 | 0.105
0.367 | 0.405
| Plot | Mito | Lyso | Perox | ER | Golgi | PM | Cytosol | Nucleus | |||||
| Expt A |
4 peptides |
13 spectra |
|
0.000 0.000 | 0.000 |
0.000 0.000 | 0.000 |
0.342 0.325 | 0.356 |
0.188 0.169 | 0.201 |
0.000 0.000 | 0.000 |
0.000 0.000 | 0.000 |
0.083 0.055 | 0.105 |
0.388 0.367 | 0.405 |
| 5 spectra, QAQQAGK | 0.000 | 0.000 | 0.312 | 0.268 | 0.000 | 0.000 | 0.000 | 0.420 | ||
| 2 spectra, MYEEHLK | 0.000 | 0.000 | 0.397 | 0.203 | 0.000 | 0.000 | 0.151 | 0.249 | ||
| 5 spectra, IYVLLR | 0.000 | 0.000 | 0.365 | 0.147 | 0.000 | 0.000 | 0.085 | 0.402 | ||
| 1 spectrum, ADTQTYQPYNK | 0.000 | 0.000 | 0.258 | 0.096 | 0.000 | 0.000 | 0.157 | 0.489 |
| Plot | Lyso | Other | |||||||||||
| Expt C |
5 peptides |
18 spectra |
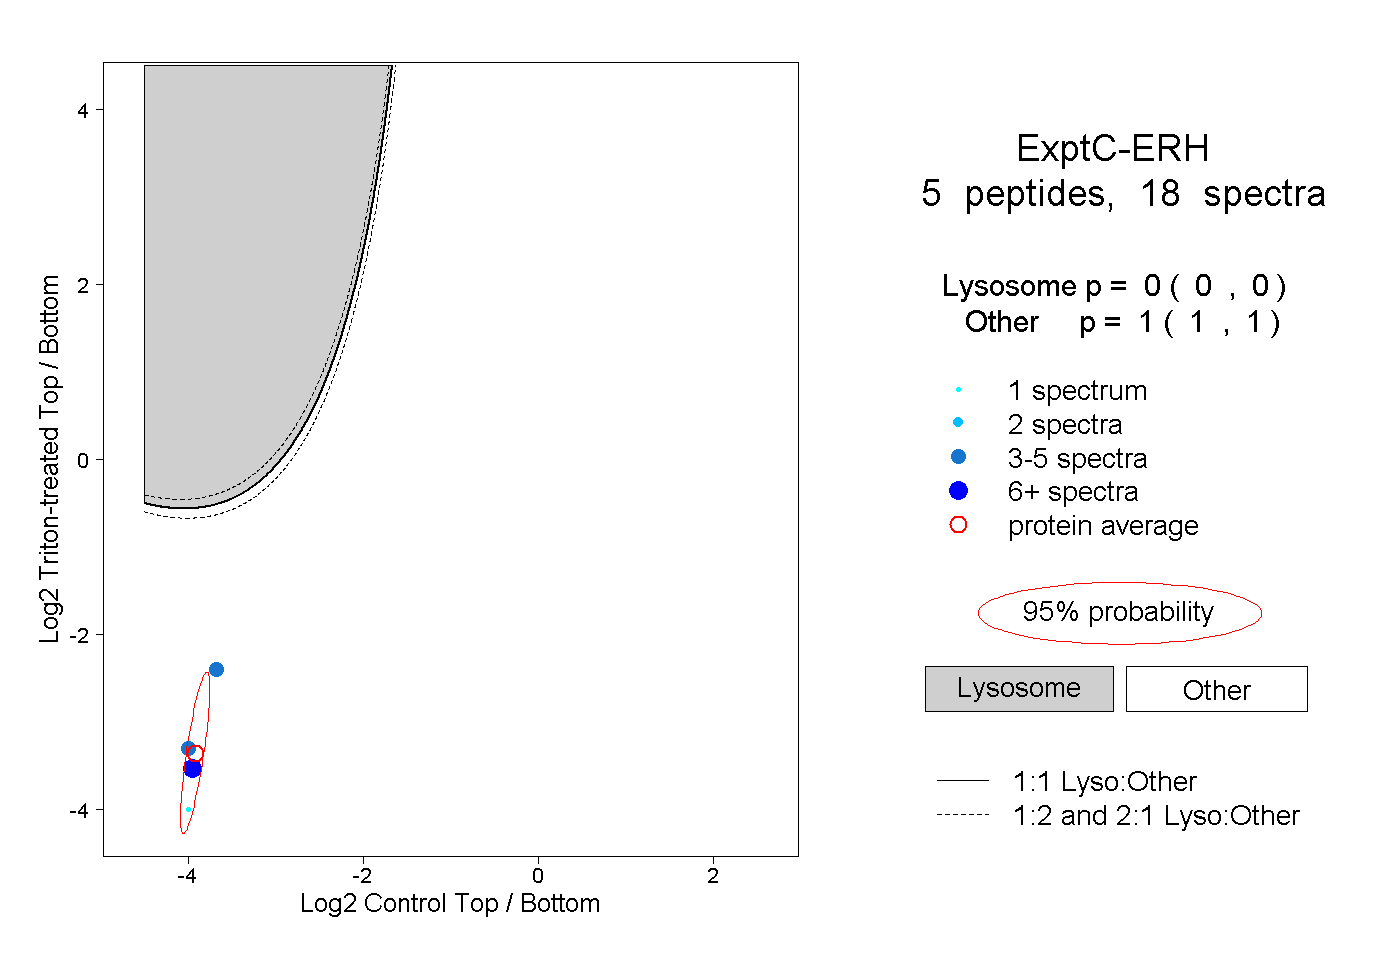 |
0.000 0.000 | 0.000 |
1.000 1.000 | 1.000 |