 3
3peptides
spectra
0.000 | 0.113
0.000 | 0.000
0.000 | 0.152
0.000 | 0.412
0.000 | 0.194
0.000 | 0.402
0.080 | 0.263
0.220 | 0.363
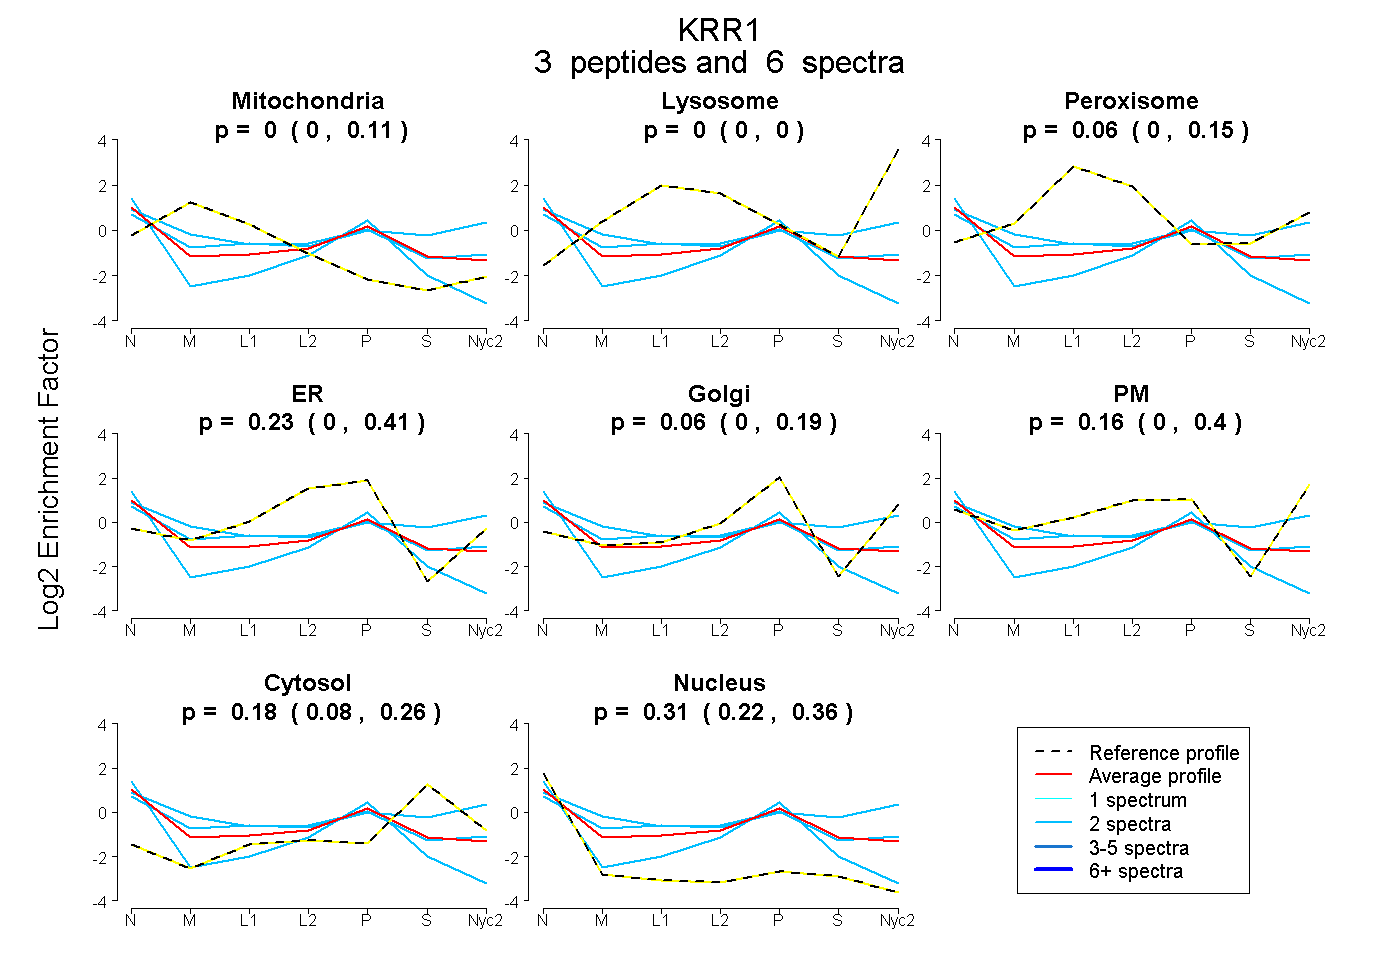
| Plot | Mito | Lyso | Perox | ER | Golgi | PM | Cytosol | Nucleus | |||||
| Expt A |
3 peptides |
6 spectra |
|
0.000 0.000 | 0.113 |
0.000 0.000 | 0.000 |
0.060 0.000 | 0.152 |
0.232 0.000 | 0.412 |
0.058 0.000 | 0.194 |
0.156 0.000 | 0.402 |
0.180 0.080 | 0.263 |
0.314 0.220 | 0.363 |
| 2 spectra, IDVAAIK | 0.035 | 0.000 | 0.000 | 0.000 | 0.000 | 0.507 | 0.404 | 0.053 | ||
| 2 spectra, LGSIVR | 0.000 | 0.000 | 0.000 | 0.413 | 0.000 | 0.000 | 0.008 | 0.579 | ||
| 2 spectra, ALNEHHVK | 0.241 | 0.000 | 0.000 | 0.160 | 0.000 | 0.289 | 0.157 | 0.153 |