 3
3peptides
spectra
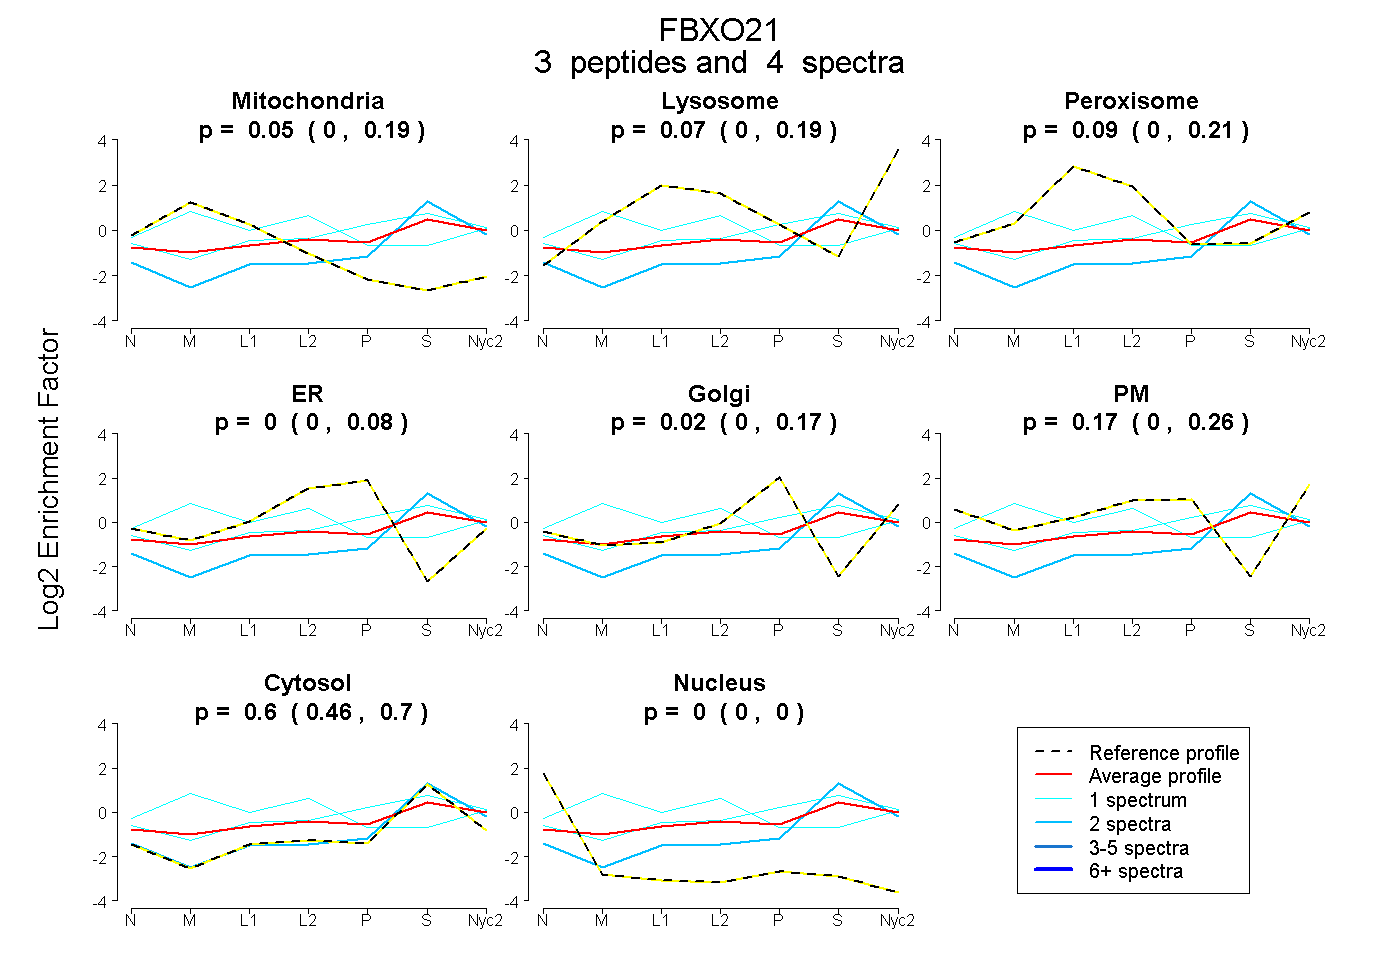
0.000 | 0.186
0.000 | 0.190
0.000 | 0.211
0.000 | 0.084
0.000 | 0.166
0.000 | 0.257
0.464 | 0.696
0.000 | 0.000
| Plot | Mito | Lyso | Perox | ER | Golgi | PM | Cytosol | Nucleus | |||||
| Expt A |
3 peptides |
4 spectra |
|
0.047 0.000 | 0.186 |
0.066 0.000 | 0.190 |
0.094 0.000 | 0.211 |
0.000 0.000 | 0.084 |
0.018 0.000 | 0.166 |
0.172 0.000 | 0.257 |
0.604 0.464 | 0.696 |
0.000 0.000 | 0.000 |
| 2 spectra, ILYYLR | 0.000 | 0.042 | 0.000 | 0.000 | 0.005 | 0.000 | 0.954 | 0.000 | ||
| 1 spectrum, ILNNLK | 0.000 | 0.039 | 0.173 | 0.000 | 0.231 | 0.013 | 0.543 | 0.000 | ||
| 1 spectrum, HPSLTFR | 0.304 | 0.110 | 0.207 | 0.000 | 0.000 | 0.198 | 0.181 | 0.000 |
| Plot | Lyso | Other | |||||||||||
| Expt C |
3 peptides |
8 spectra |
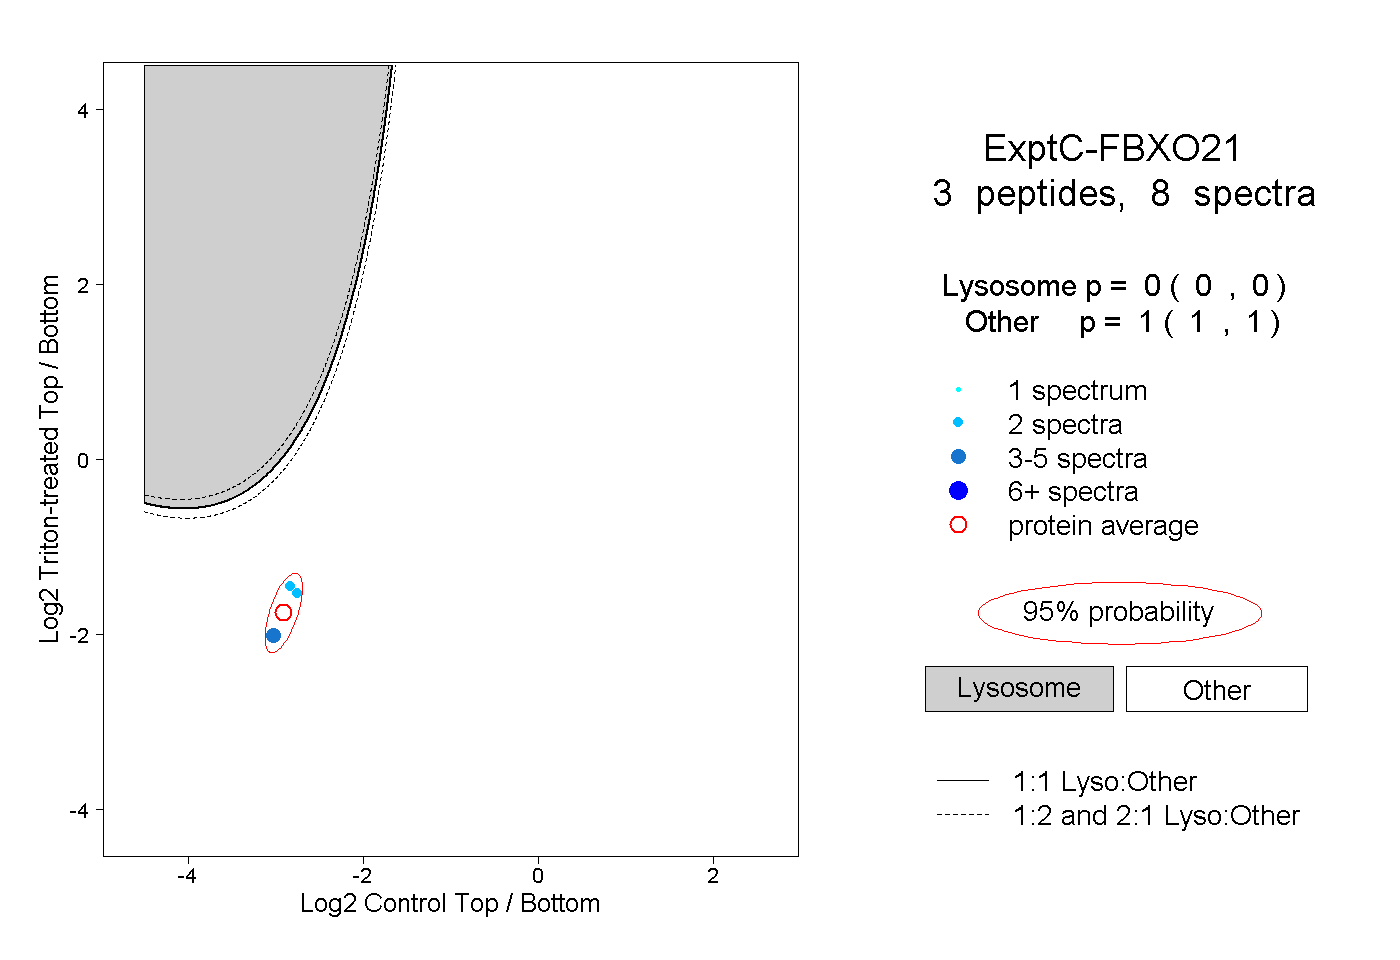 |
0.000 0.000 | 0.000 |
1.000 1.000 | 1.000 |