NCKAP1
[ENSRNOP00000059233]
Main page
| | | Plot |
Mito |
Lyso |
|
Perox |
ER |
Golgi |
PM |
Cytosol |
Nucleus |
|
| Expt A |
 16
16
peptides |
39
spectra |
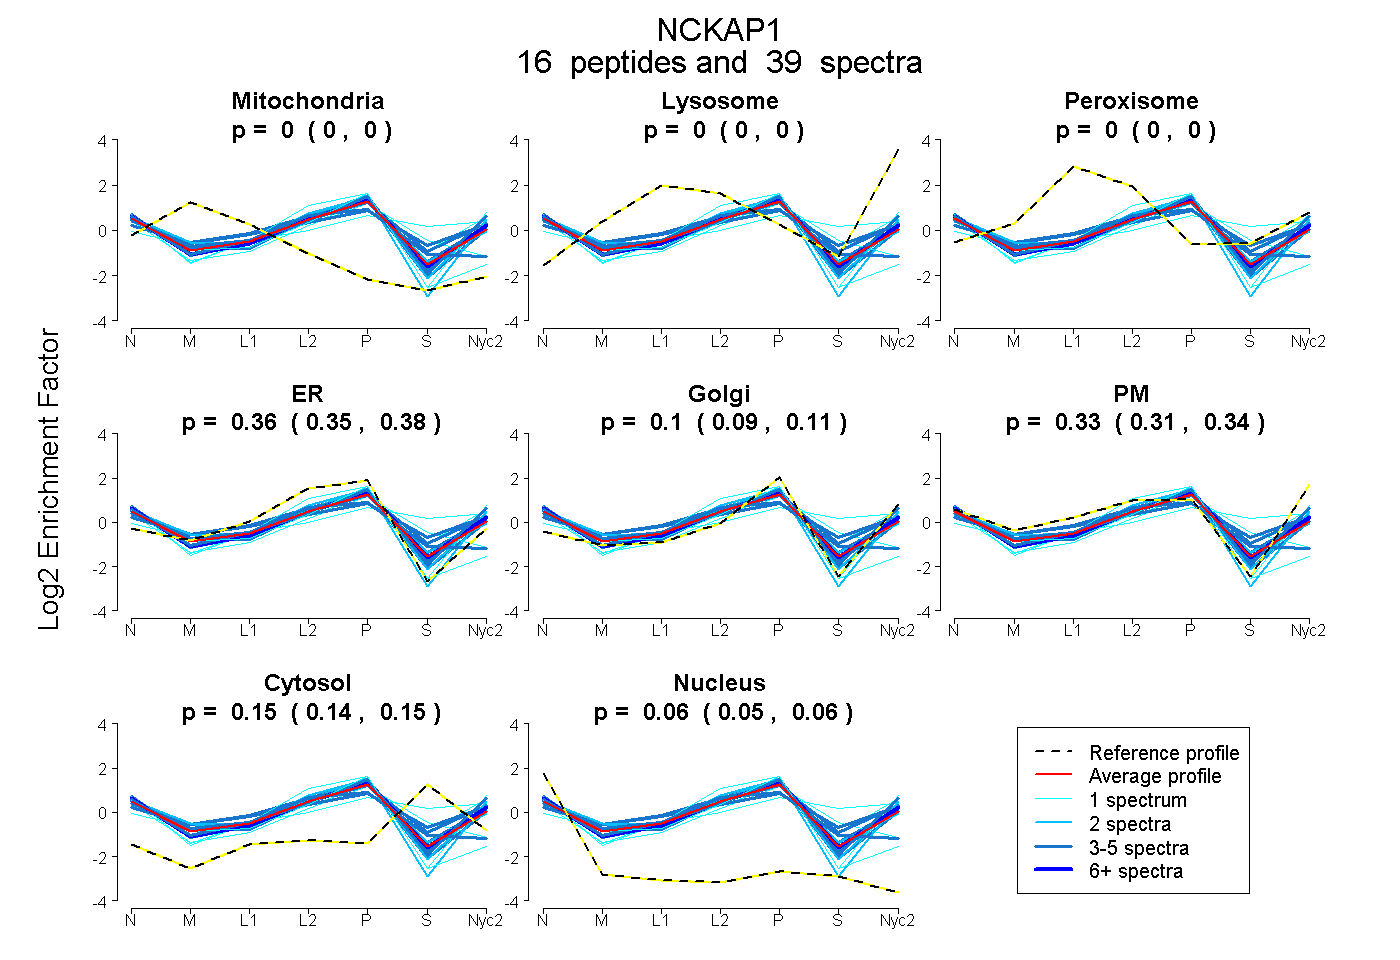 |
0.000
0.000 | 0.000 |
0.000
0.000 | 0.000 |
|
0.000
0.000 | 0.000 |
0.364
0.345 | 0.383 |
0.103
0.088 | 0.115 |
0.331
0.315 | 0.343 |
0.145
0.136 | 0.153 |
0.057
0.051 | 0.062 |
|
| | | Plot |
Mito |
|
Lyso or Perox |
|
ER |
Golgi |
PM |
Cytosol |
Nucleus |
|
| Expt B |
3
peptides |
5
spectra |
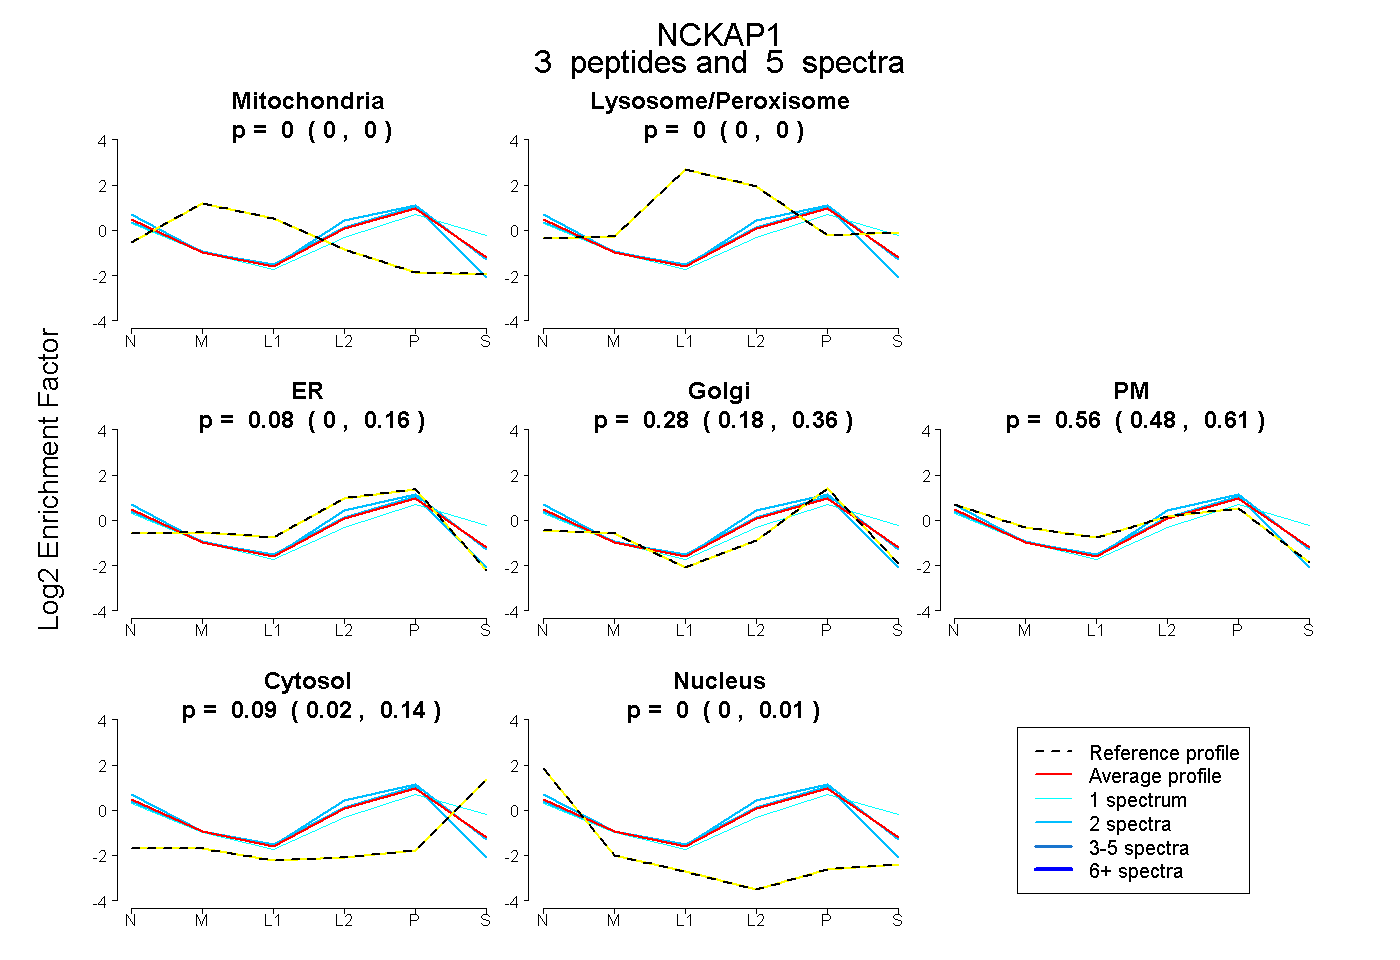 |
0.000
0.000 | 0.000 |
|
0.000
0.000 | 0.000 |
|
0.077
0.000 | 0.160 |
0.276
0.176 | 0.356 |
0.558
0.482 | 0.609 |
0.088
0.017 | 0.143 |
0.000
0.000 | 0.005 |
|
| 2 spectra, AAEDLFVNIR |
0.000 |
|
0.000 |
|
0.180 |
0.254 |
0.516 |
0.000 |
0.050 |
|
| 1 spectrum, SLAQEALR |
0.000 |
|
0.008 |
|
0.000 |
0.226 |
0.501 |
0.265 |
0.000 |
|
| 2 spectra, DEVFHIHK |
0.000 |
|
0.000 |
|
0.269 |
0.216 |
0.447 |
0.067 |
0.000 |
|
| | | Plot |
|
Lyso |
|
|
|
|
|
|
|
Other |
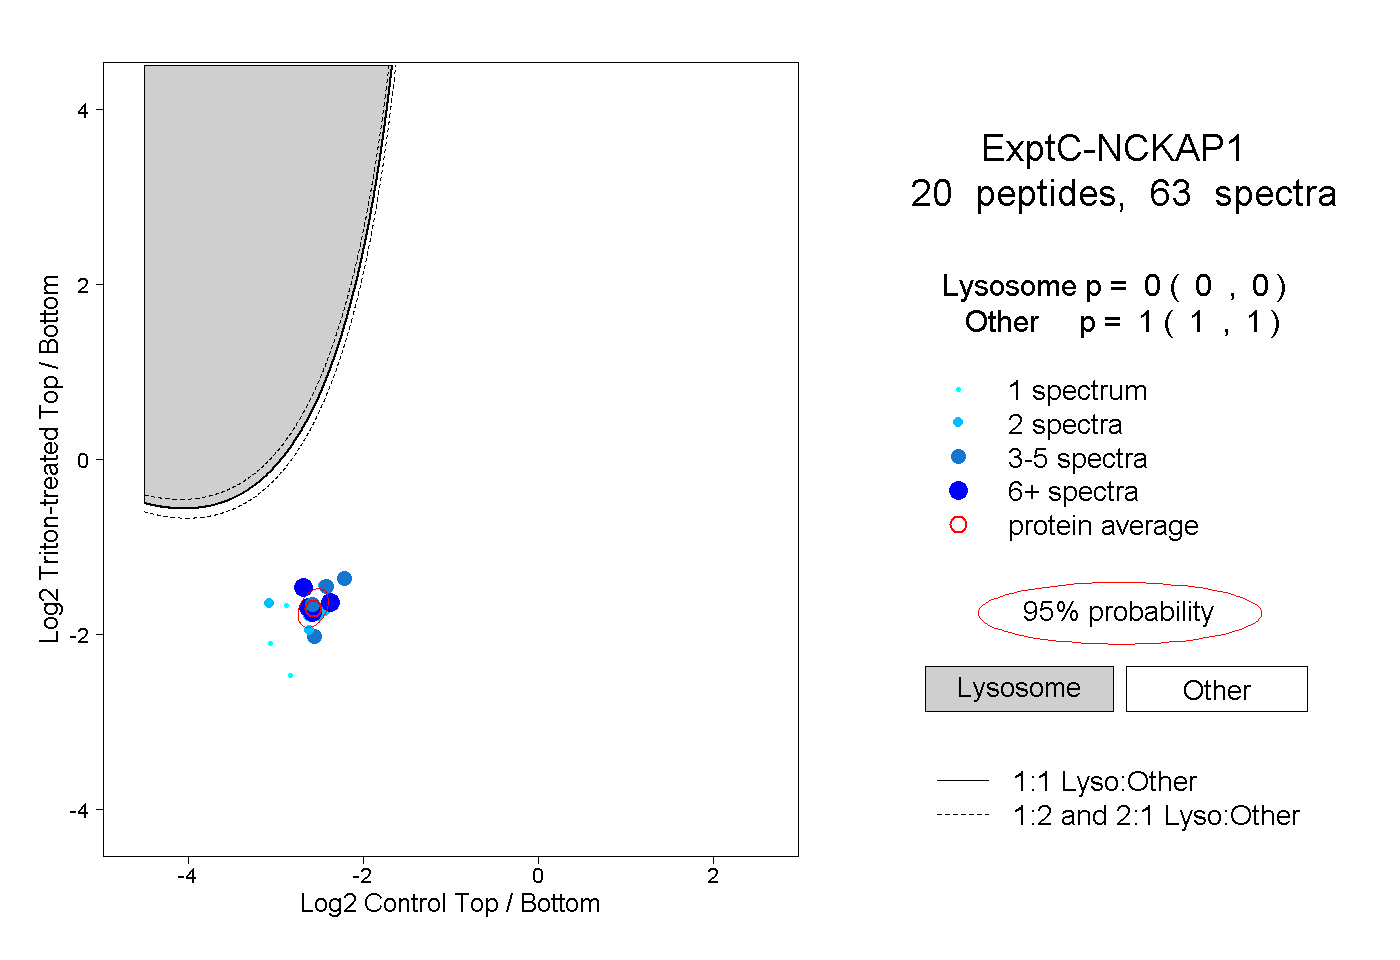
| Expt C |
20
peptides |
63
spectra |
 |
|
0.000
0.000 | 0.000 |
|
|
|
|
|
|
|
1.000
1.000 | 1.000 |
| | | Plot |
|
Lyso |
|
|
|
|
|
|
|
Other |
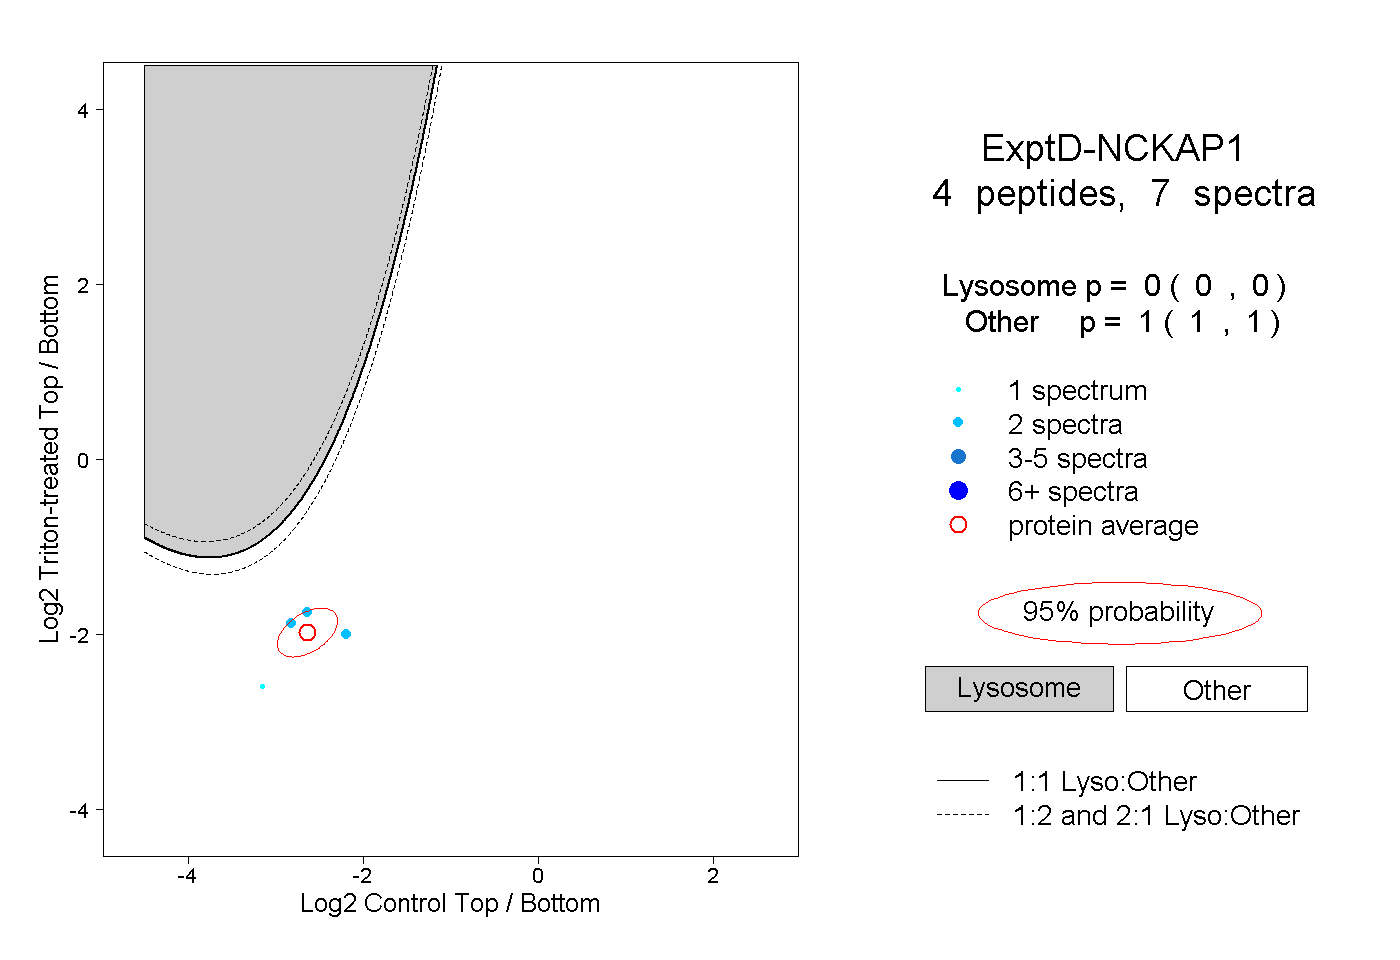
| Expt D |
4
peptides |
7
spectra |
 |
|
0.000
0.000 | 0.000 |
|
|
|
|
|
|
|
1.000
1.000 | 1.000 |