 16
16peptides
spectra
0.000 | 0.000
0.000 | 0.000
0.000 | 0.000
0.345 | 0.383
0.088 | 0.115
0.315 | 0.343
0.136 | 0.153
0.051 | 0.062
| Plot | Mito | Lyso | Perox | ER | Golgi | PM | Cytosol | Nucleus | |||||
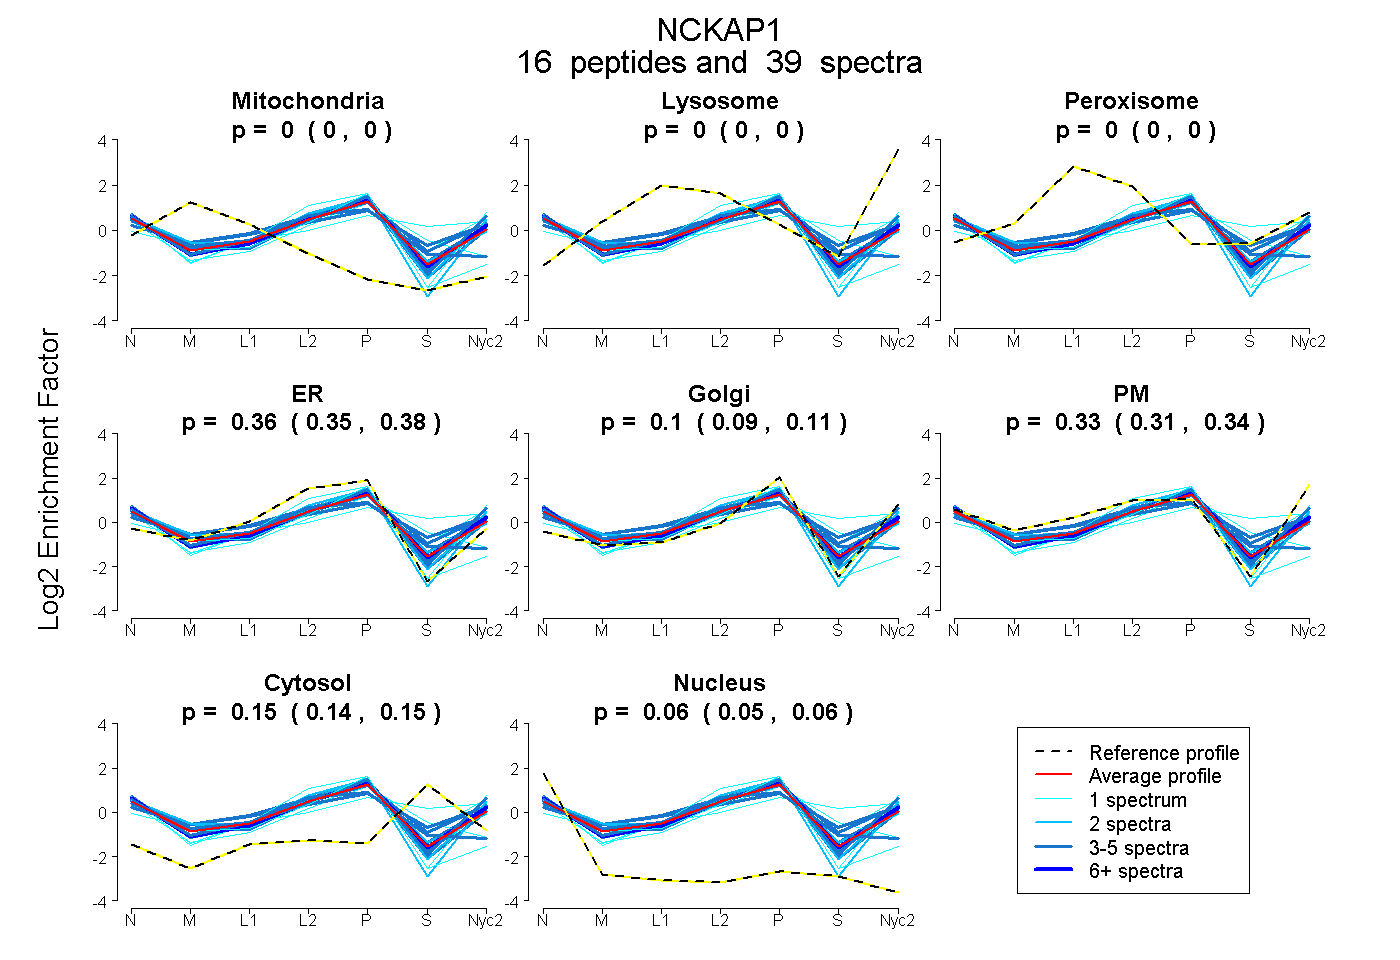
| Expt A |
16 peptides |
39 spectra |
|
0.000 0.000 | 0.000 |
0.000 0.000 | 0.000 |
0.000 0.000 | 0.000 |
0.364 0.345 | 0.383 |
0.103 0.088 | 0.115 |
0.331 0.315 | 0.343 |
0.145 0.136 | 0.153 |
0.057 0.051 | 0.062 |
| 1 spectrum, LALQSSSCLSLFR | 0.000 | 0.000 | 0.000 | 0.576 | 0.000 | 0.000 | 0.349 | 0.075 | ||
| 3 spectra, EKPGVESMR | 0.000 | 0.000 | 0.000 | 0.275 | 0.163 | 0.346 | 0.167 | 0.049 | ||
| 3 spectra, AAEDLFVNIR | 0.000 | 0.000 | 0.000 | 0.306 | 0.164 | 0.357 | 0.089 | 0.084 | ||
| 2 spectra, NLSADQWR | 0.000 | 0.000 | 0.000 | 0.323 | 0.173 | 0.433 | 0.000 | 0.071 | ||
| 1 spectrum, NAYHAVYK | 0.000 | 0.000 | 0.143 | 0.000 | 0.195 | 0.272 | 0.390 | 0.000 | ||
| 1 spectrum, NNNQQLAQLQK | 0.000 | 0.000 | 0.000 | 0.328 | 0.195 | 0.428 | 0.000 | 0.049 | ||
| 3 spectra, MMNTIIFHTK | 0.000 | 0.000 | 0.105 | 0.265 | 0.134 | 0.297 | 0.199 | 0.000 | ||
| 4 spectra, DEVFHIHK | 0.000 | 0.000 | 0.000 | 0.413 | 0.134 | 0.326 | 0.030 | 0.097 | ||
| 1 spectrum, AKPSYLIDK | 0.000 | 0.000 | 0.000 | 0.090 | 0.182 | 0.472 | 0.256 | 0.000 | ||
| 3 spectra, MMEEFVPHSK | 0.000 | 0.000 | 0.066 | 0.187 | 0.000 | 0.461 | 0.286 | 0.000 | ||
| 6 spectra, SADDFIDK | 0.000 | 0.000 | 0.000 | 0.270 | 0.201 | 0.347 | 0.121 | 0.060 | ||
| 1 spectrum, SLSLCNMFLDEMAK | 0.000 | 0.000 | 0.000 | 0.787 | 0.000 | 0.000 | 0.000 | 0.213 | ||
| 2 spectra, HADNMPK | 0.007 | 0.000 | 0.000 | 0.399 | 0.130 | 0.268 | 0.167 | 0.030 | ||
| 3 spectra, SLSELLGPYGMK | 0.000 | 0.000 | 0.000 | 0.140 | 0.318 | 0.426 | 0.064 | 0.052 | ||
| 2 spectra, LSSVDSVLK | 0.000 | 0.000 | 0.000 | 0.278 | 0.255 | 0.372 | 0.022 | 0.072 | ||
| 3 spectra, SENISPEEEYK | 0.000 | 0.000 | 0.107 | 0.598 | 0.000 | 0.000 | 0.168 | 0.126 |
| Plot | Mito | Lyso or Perox | ER | Golgi | PM | Cytosol | Nucleus | ||||||
| Expt B |
3 peptides |
5 spectra |
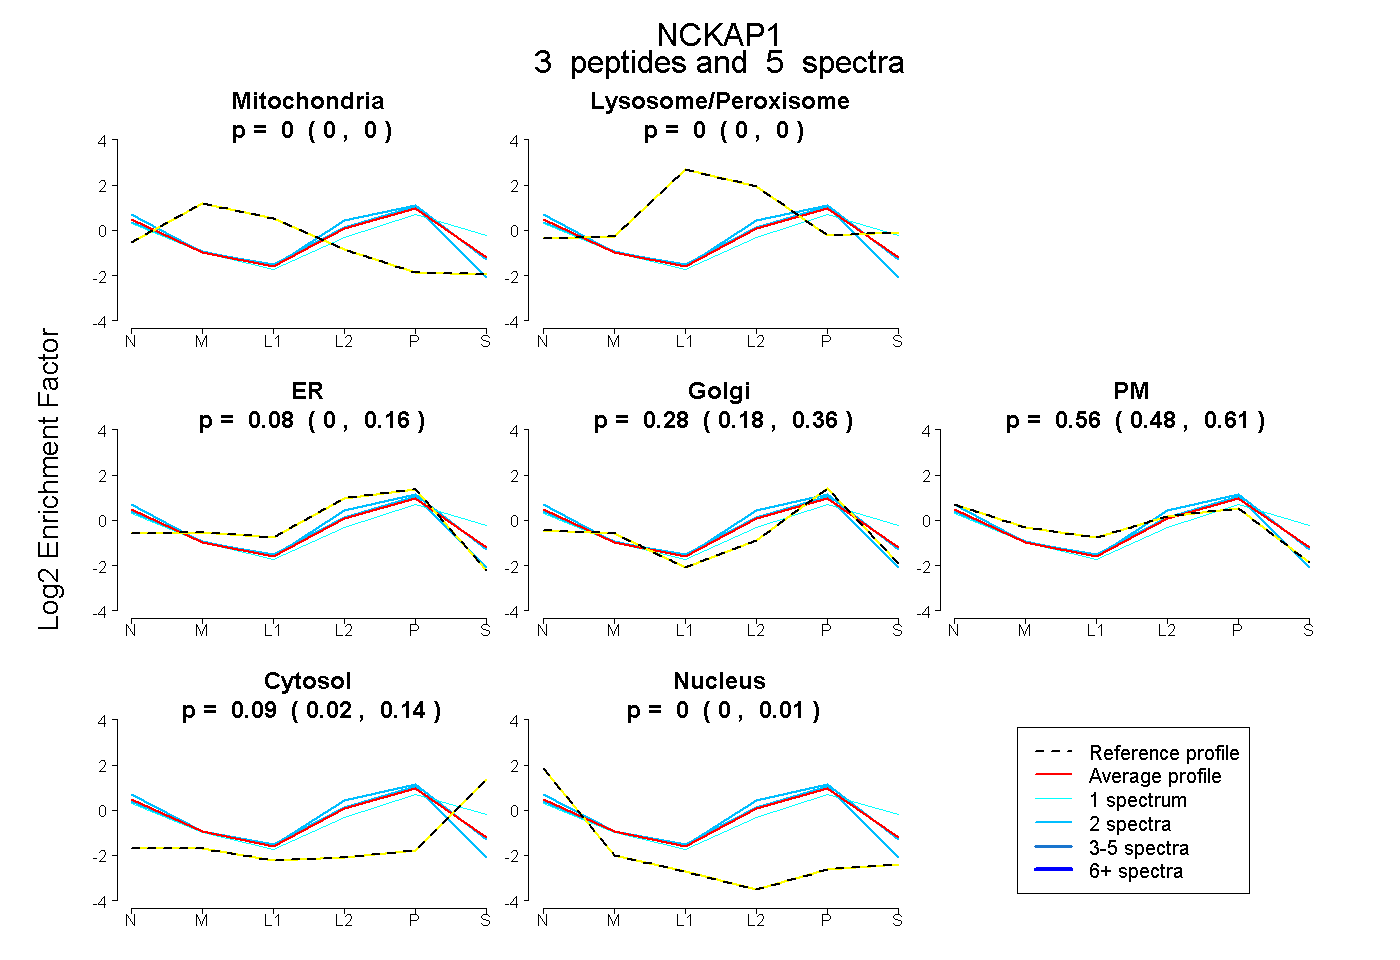 |
0.000 0.000 | 0.000 |
0.000 0.000 | 0.000 |
0.077 0.000 | 0.160 |
0.276 0.176 | 0.356 |
0.558 0.482 | 0.609 |
0.088 0.017 | 0.143 |
0.000 0.000 | 0.005 |
|||
| Plot | Lyso | Other | |||||||||||
| Expt C |
20 peptides |
63 spectra |
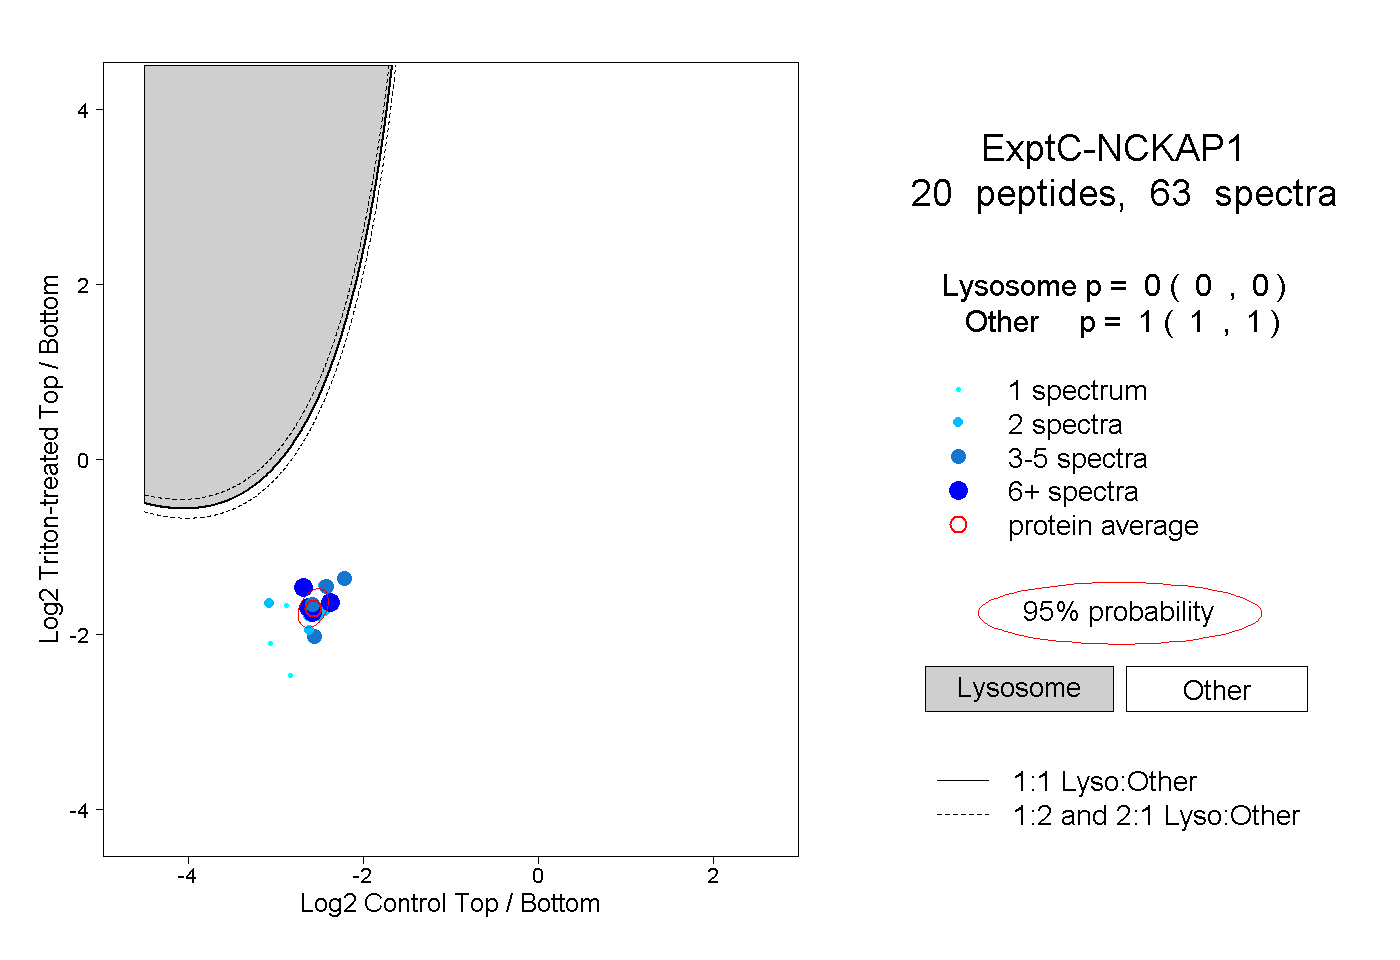 |
0.000 0.000 | 0.000 |
1.000 1.000 | 1.000 |
||||||||
| Plot | Lyso | Other | |||||||||||
| Expt D |
4 peptides |
7 spectra |
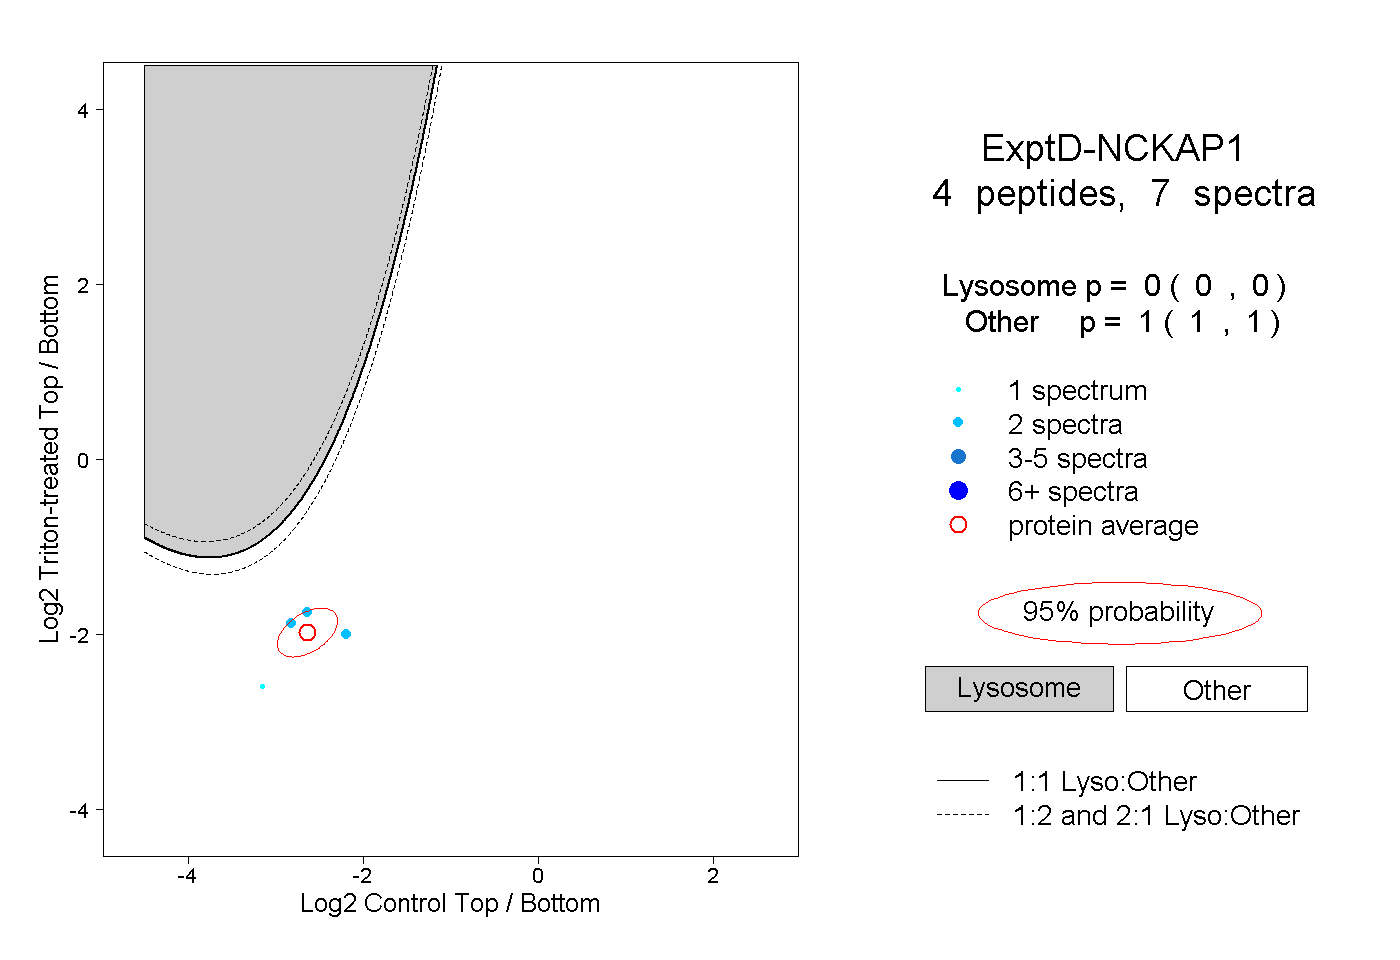 |
0.000 0.000 | 0.000 |
1.000 1.000 | 1.000 |