 2
2peptides
spectra
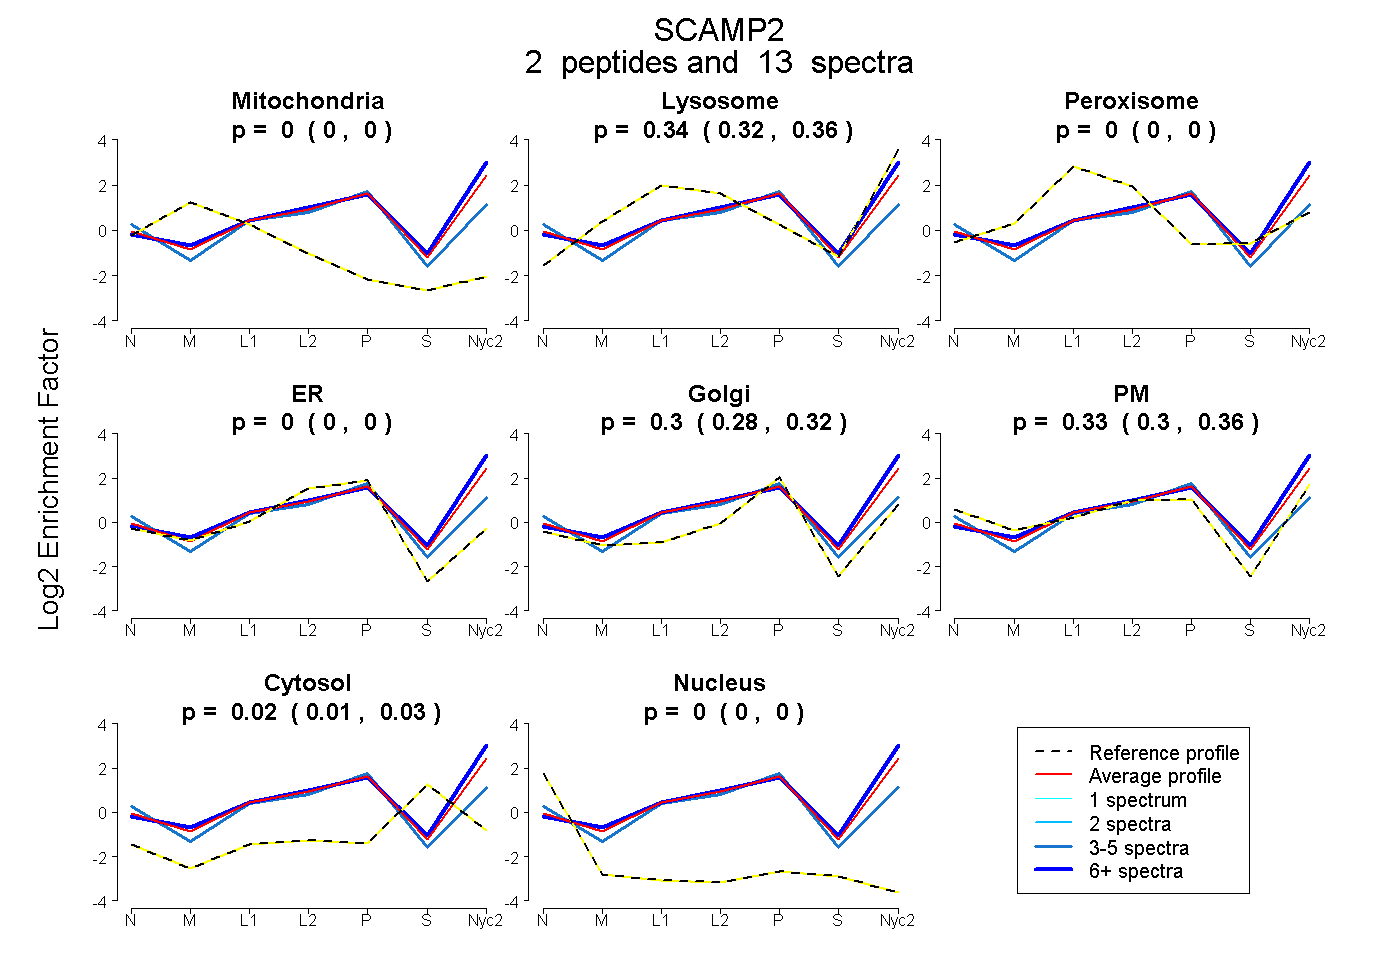
0.000 | 0.000
0.317 | 0.359
0.000 | 0.000
0.000 | 0.000
0.283 | 0.322
0.301 | 0.355
0.012 | 0.034
0.000 | 0.000
1peptide
spectrum
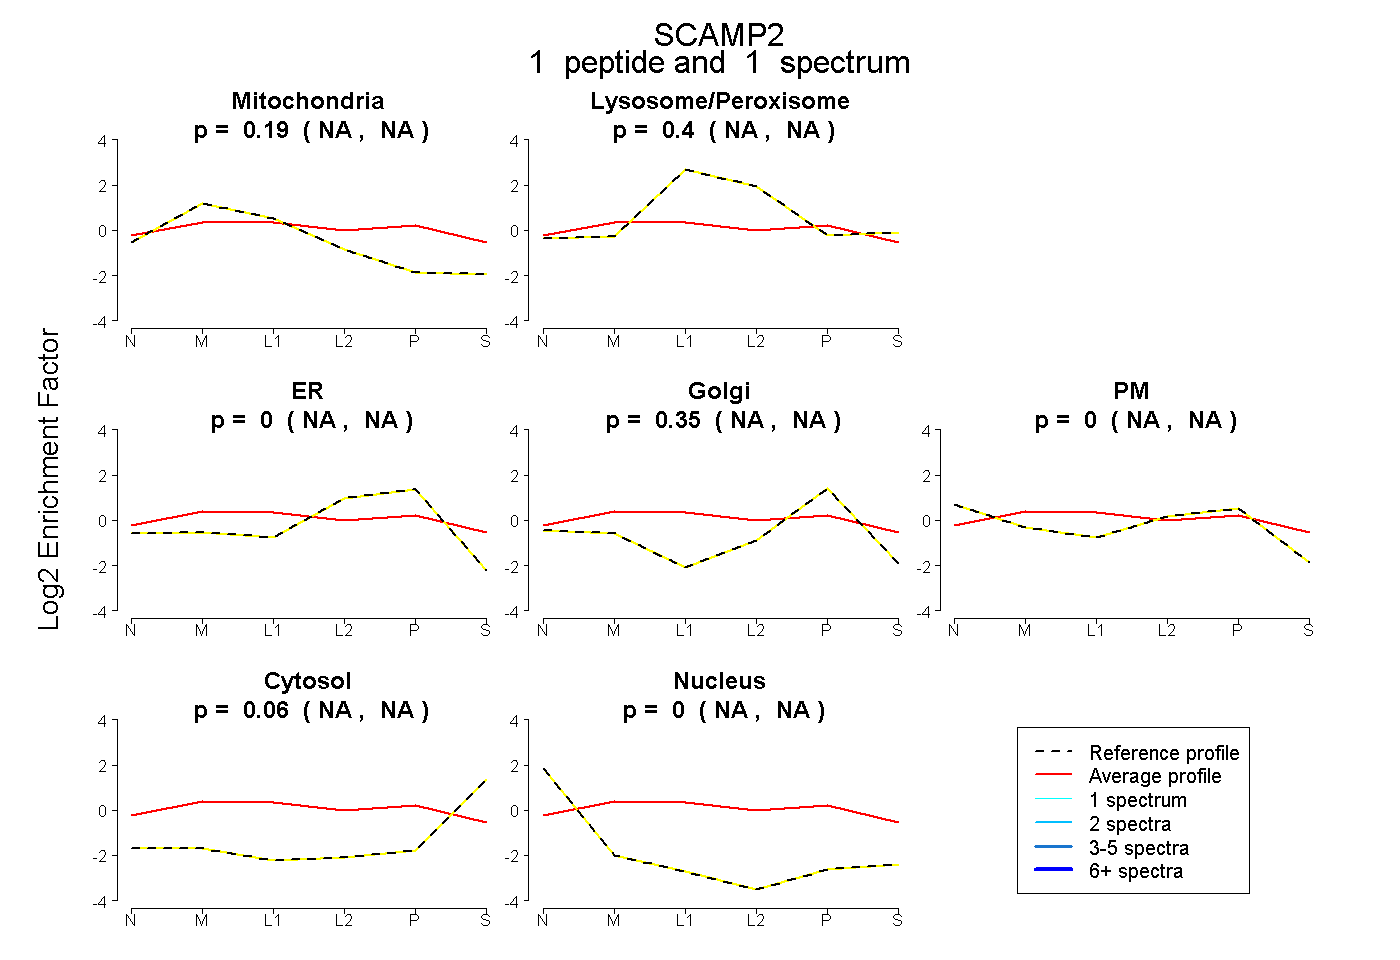
NA | NA
NA | NA
NA | NA
NA | NA
NA | NA
NA | NA
NA | NA
3peptides
spectra
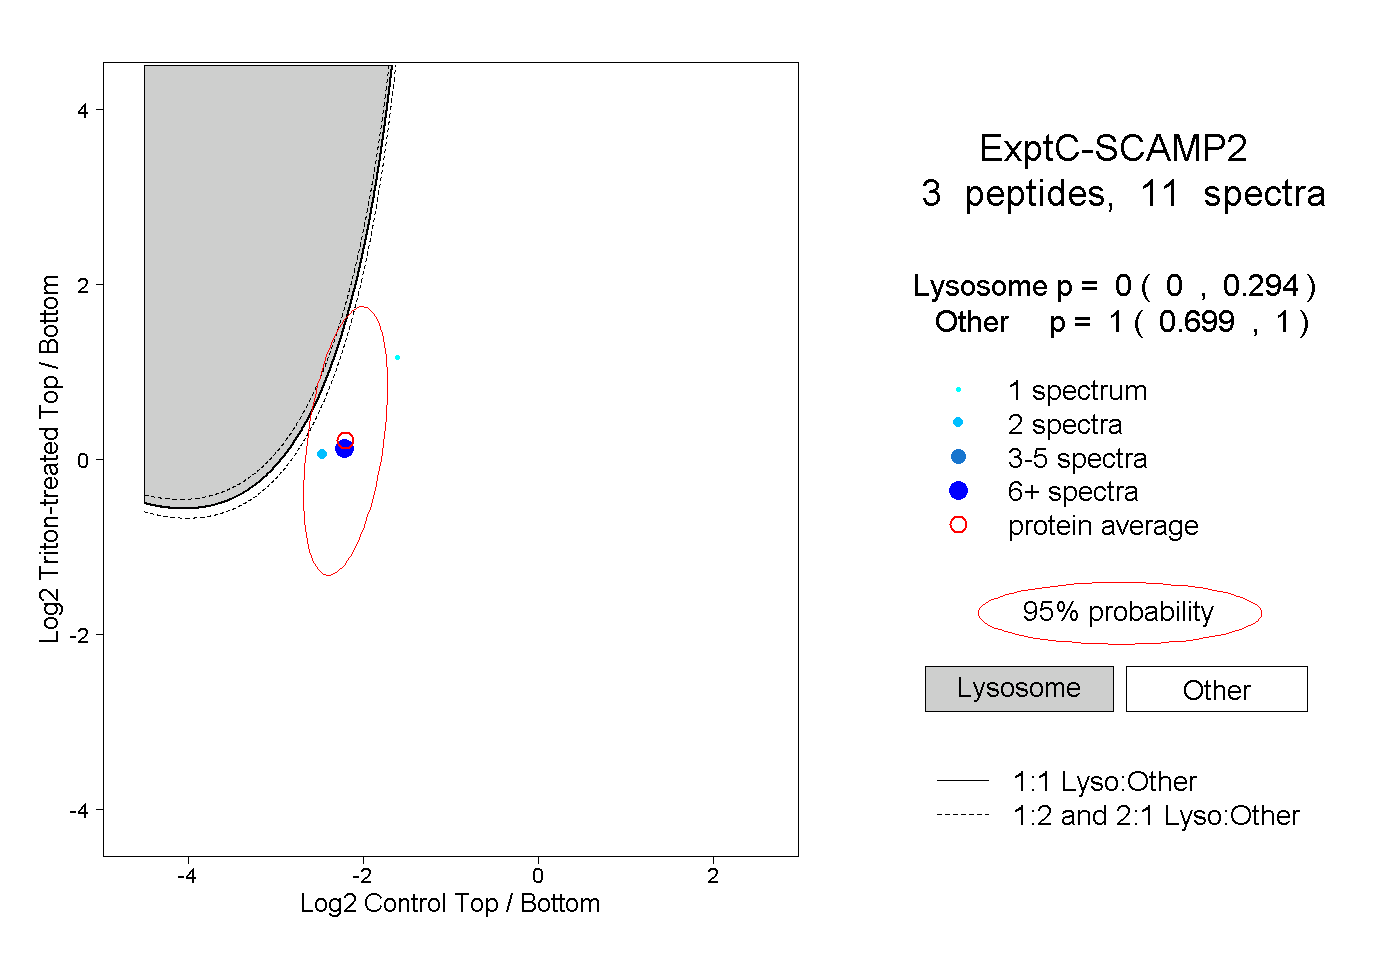
0.000 | 0.294
0.699 | 1.000
1peptide
spectrum
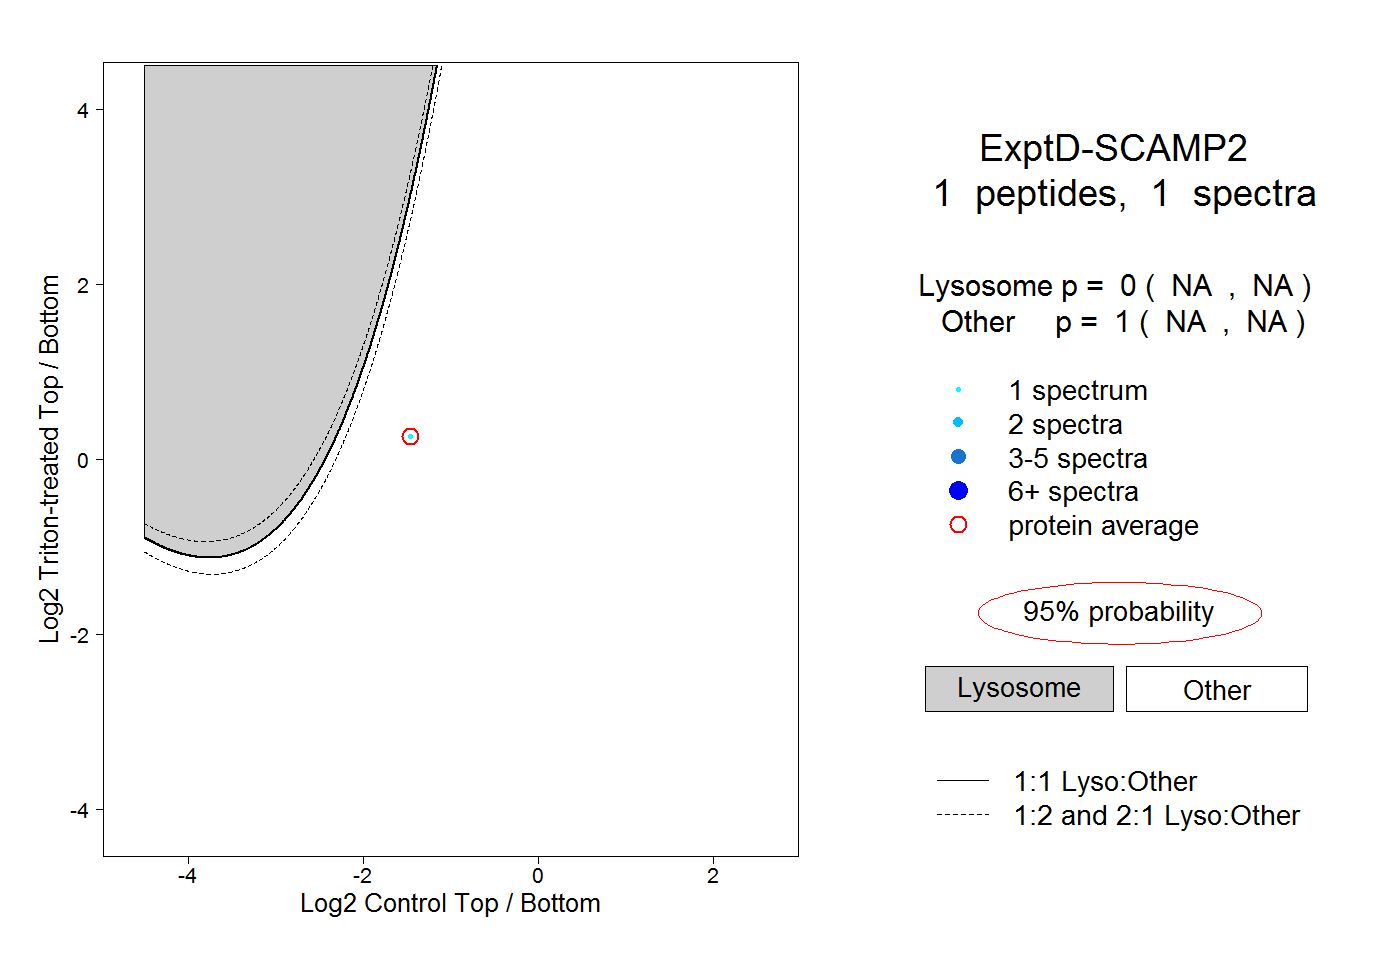
NA | NA
NA | NA