 3
3peptides
spectra
0.000 | 0.000
0.000 | 0.000
0.000 | 0.000
0.000 | 0.432
0.000 | 0.442
0.000 | 0.078
0.169 | 0.346
0.182 | 0.439
1peptide
spectrum
NA | NA
NA | NA
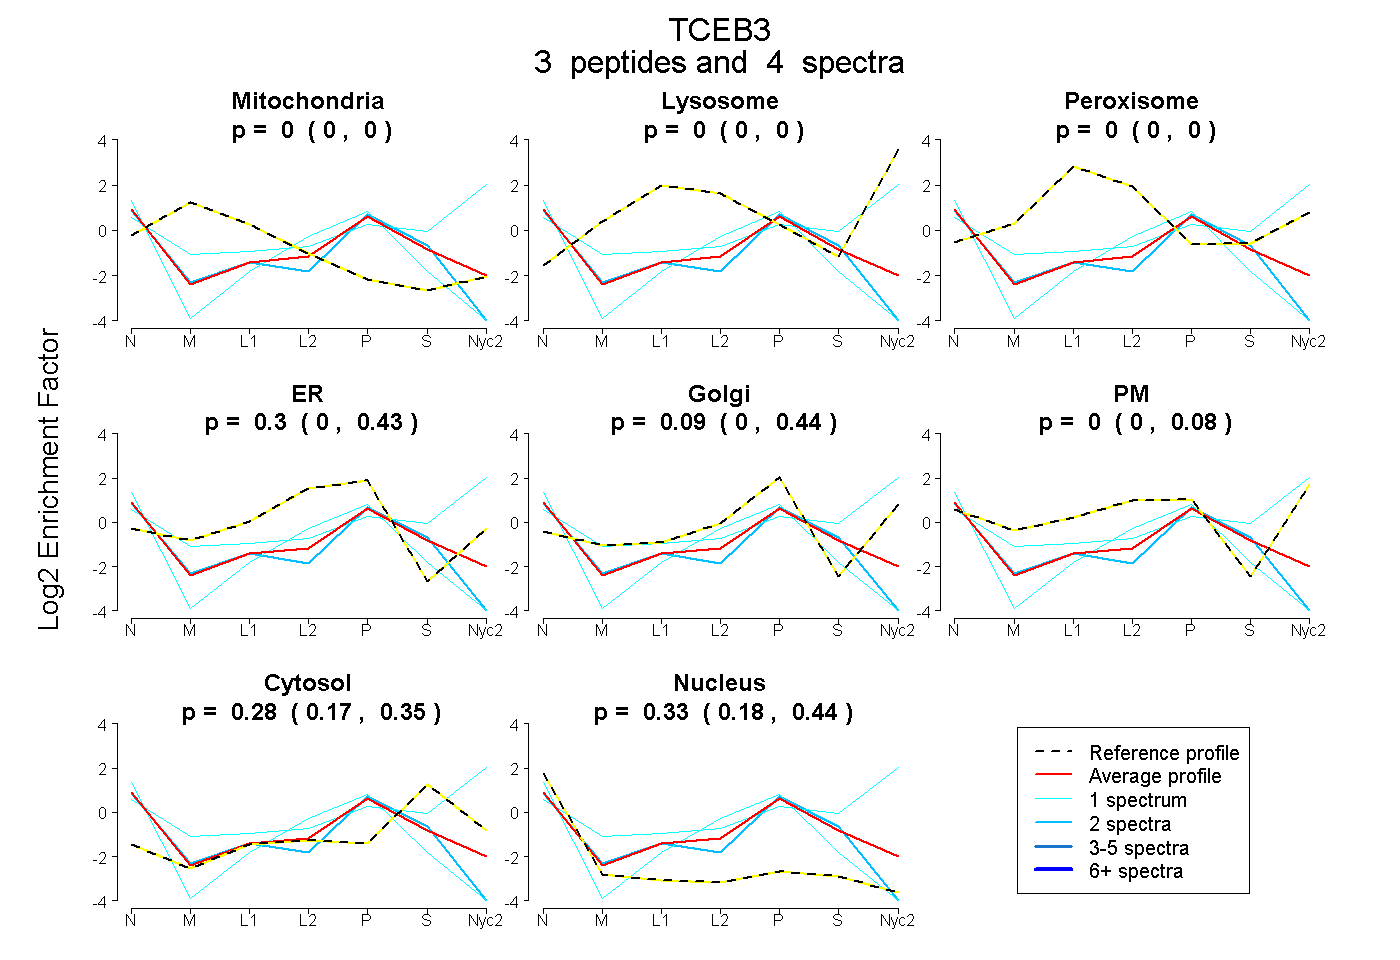
| Plot | Mito | Lyso | Perox | ER | Golgi | PM | Cytosol | Nucleus | |||||
| Expt A |
3 peptides |
4 spectra |
|
0.000 0.000 | 0.000 |
0.000 0.000 | 0.000 |
0.000 0.000 | 0.000 |
0.298 0.000 | 0.432 |
0.095 0.000 | 0.442 |
0.000 0.000 | 0.078 |
0.278 0.169 | 0.346 |
0.329 0.182 | 0.439 |
||
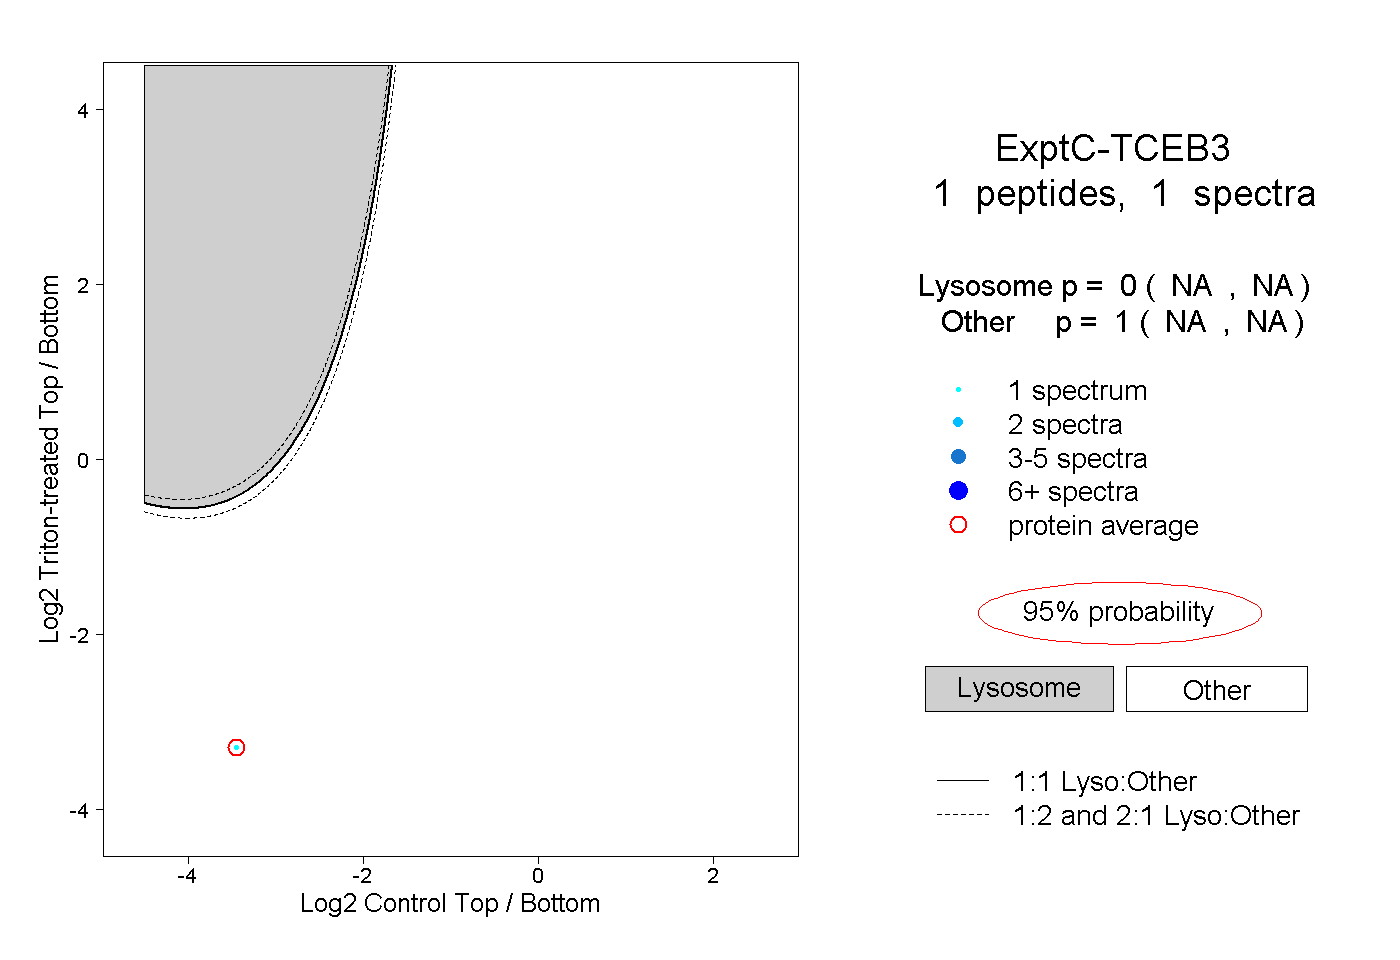
| Plot | Lyso | Other | |||||||||||
| Expt C |
1 peptide |
1 spectrum |
|
0.000 NA | NA |
1.000 NA | NA |