 2
2peptides
spectra
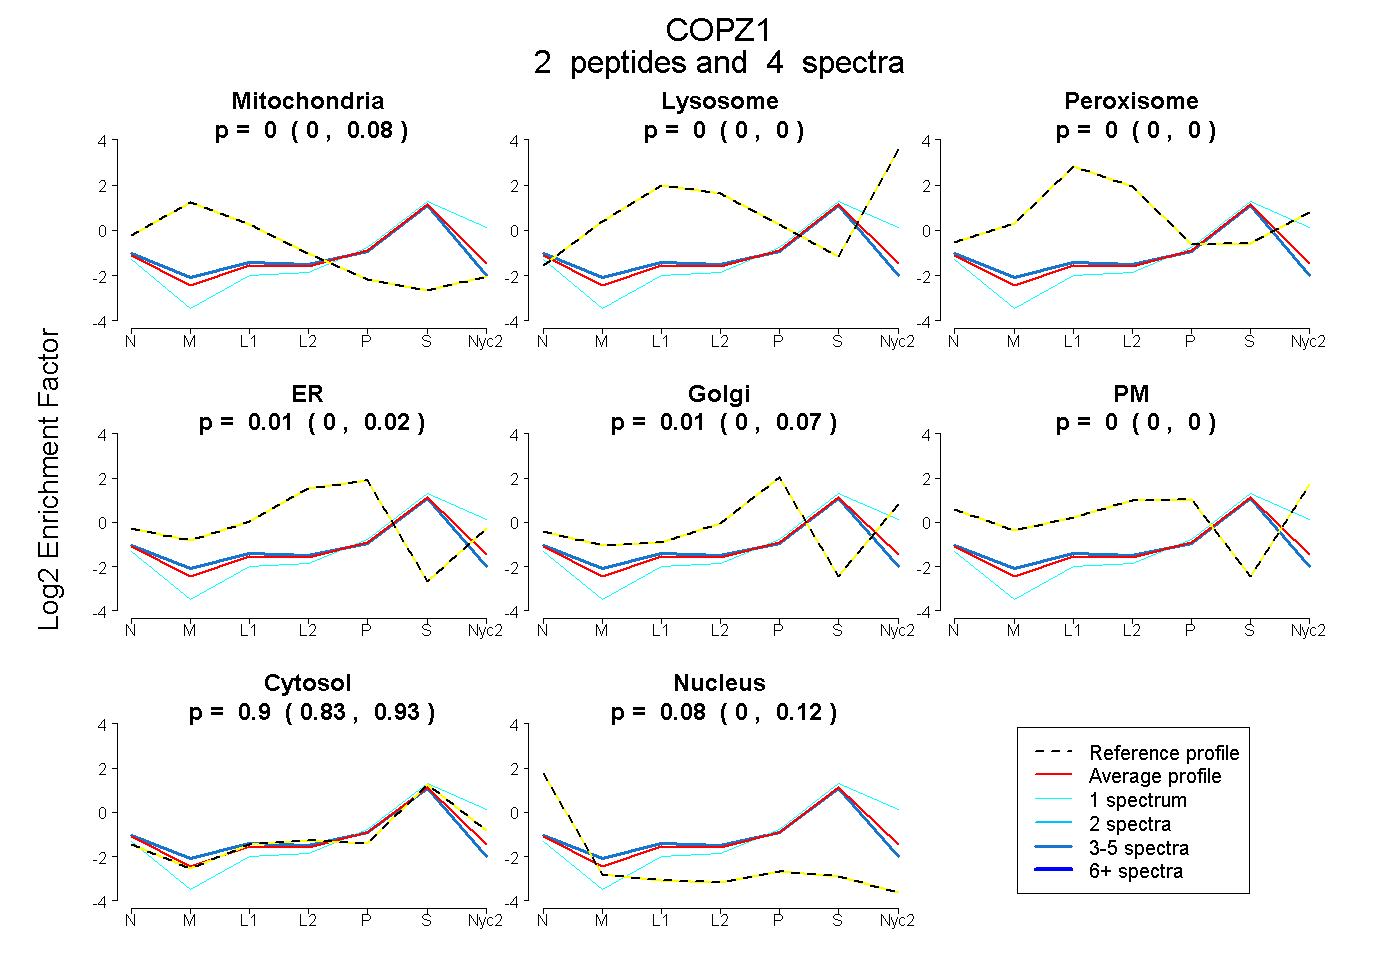
0.000 | 0.083
0.000 | 0.000
0.000 | 0.000
0.000 | 0.024
0.000 | 0.072
0.000 | 0.000
0.833 | 0.933
0.002 | 0.122
2peptides
spectra
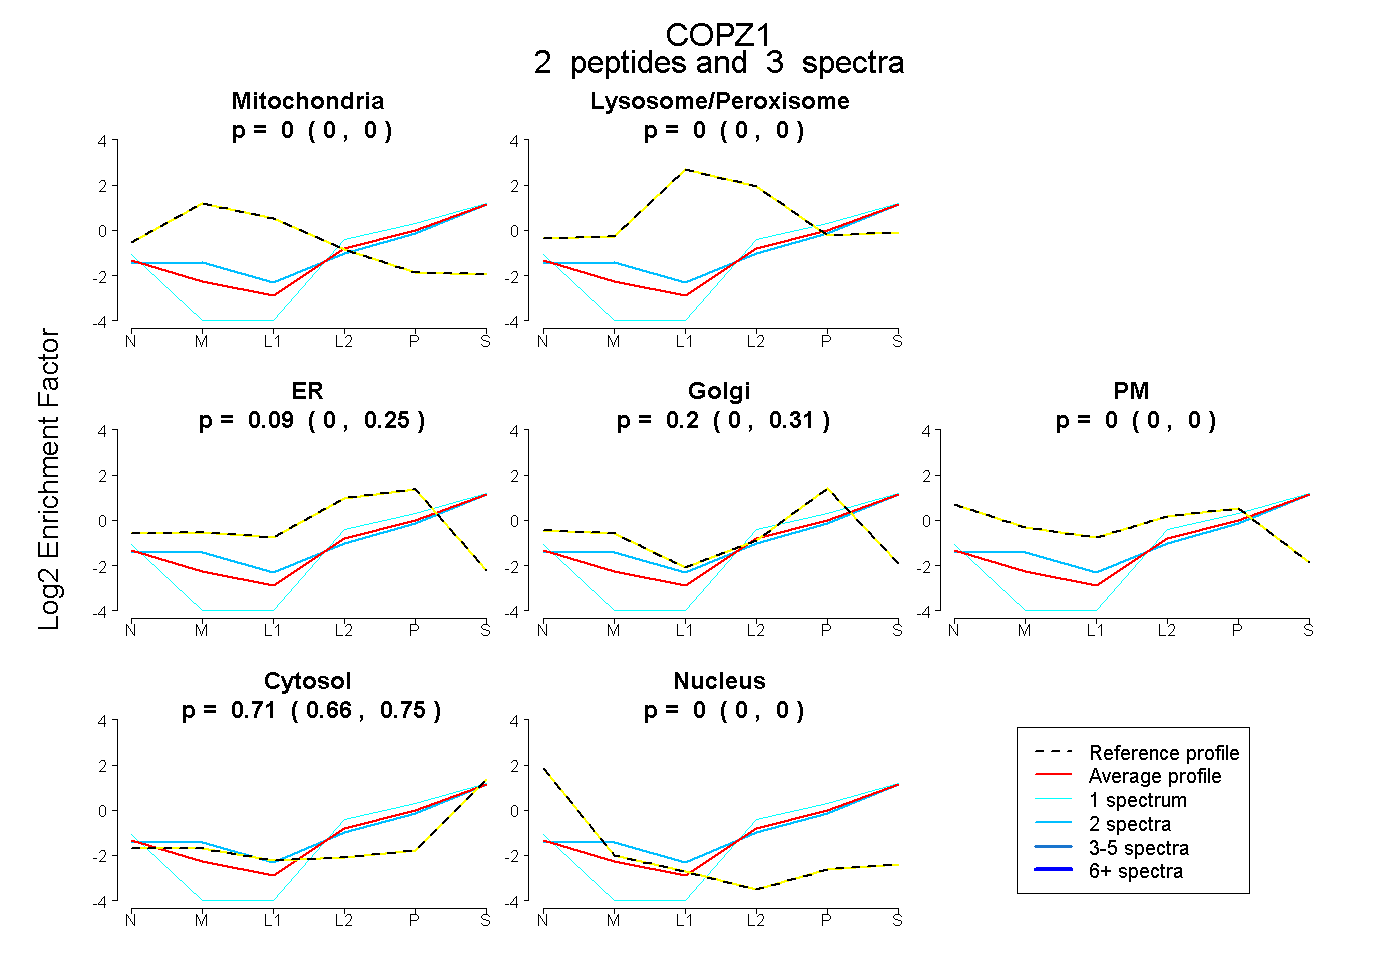
0.000 | 0.000
0.000 | 0.000
0.000 | 0.253
0.000 | 0.315
0.000 | 0.000
0.660 | 0.753
0.000 | 0.000
2peptides
spectra
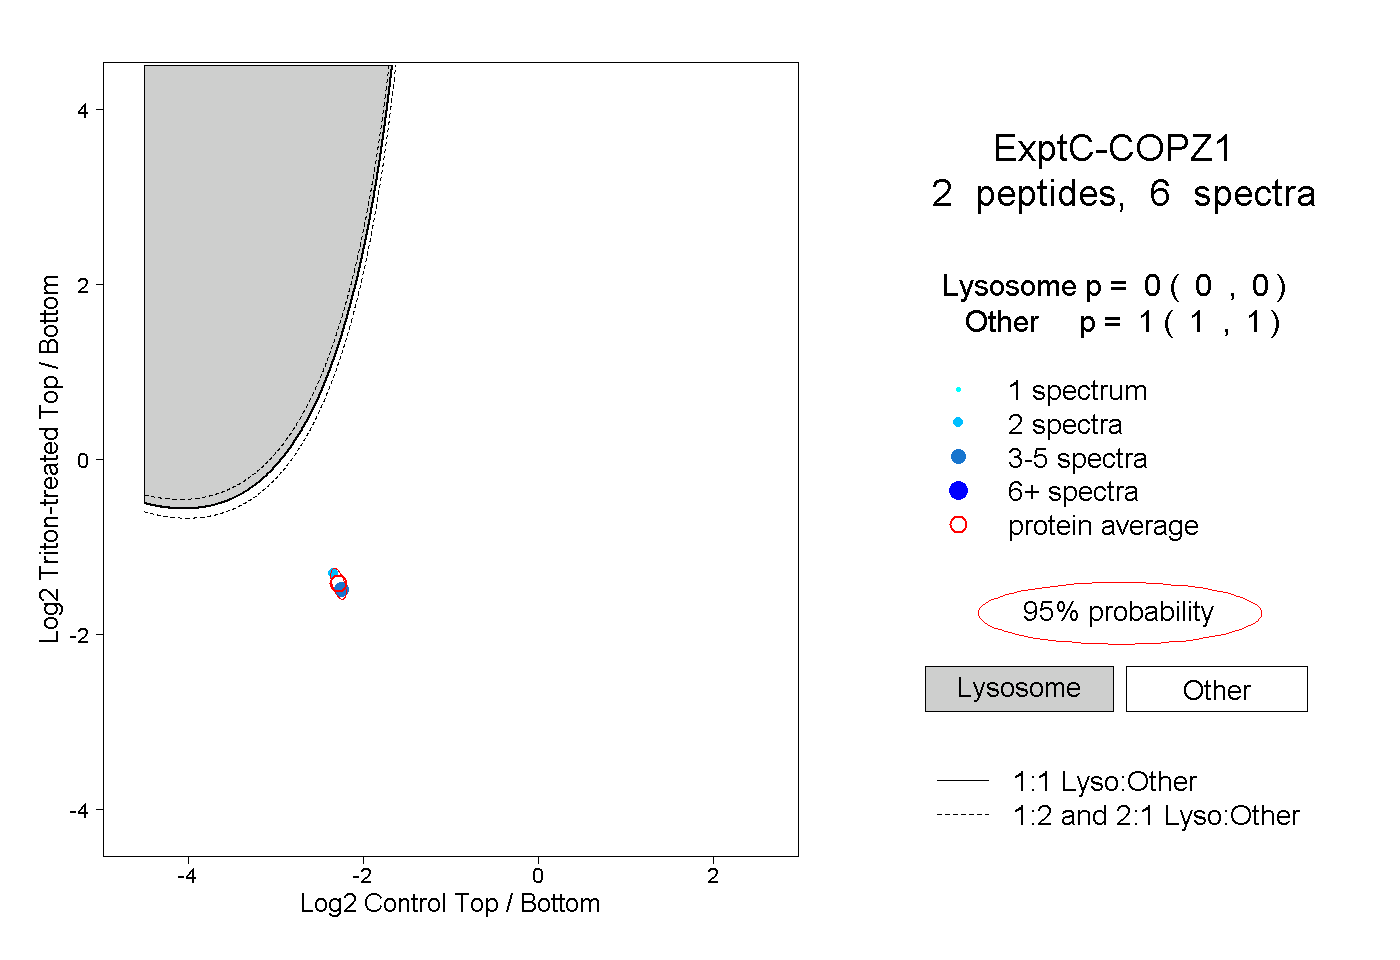
0.000 | 0.000
1.000 | 1.000