31
31peptides
spectra
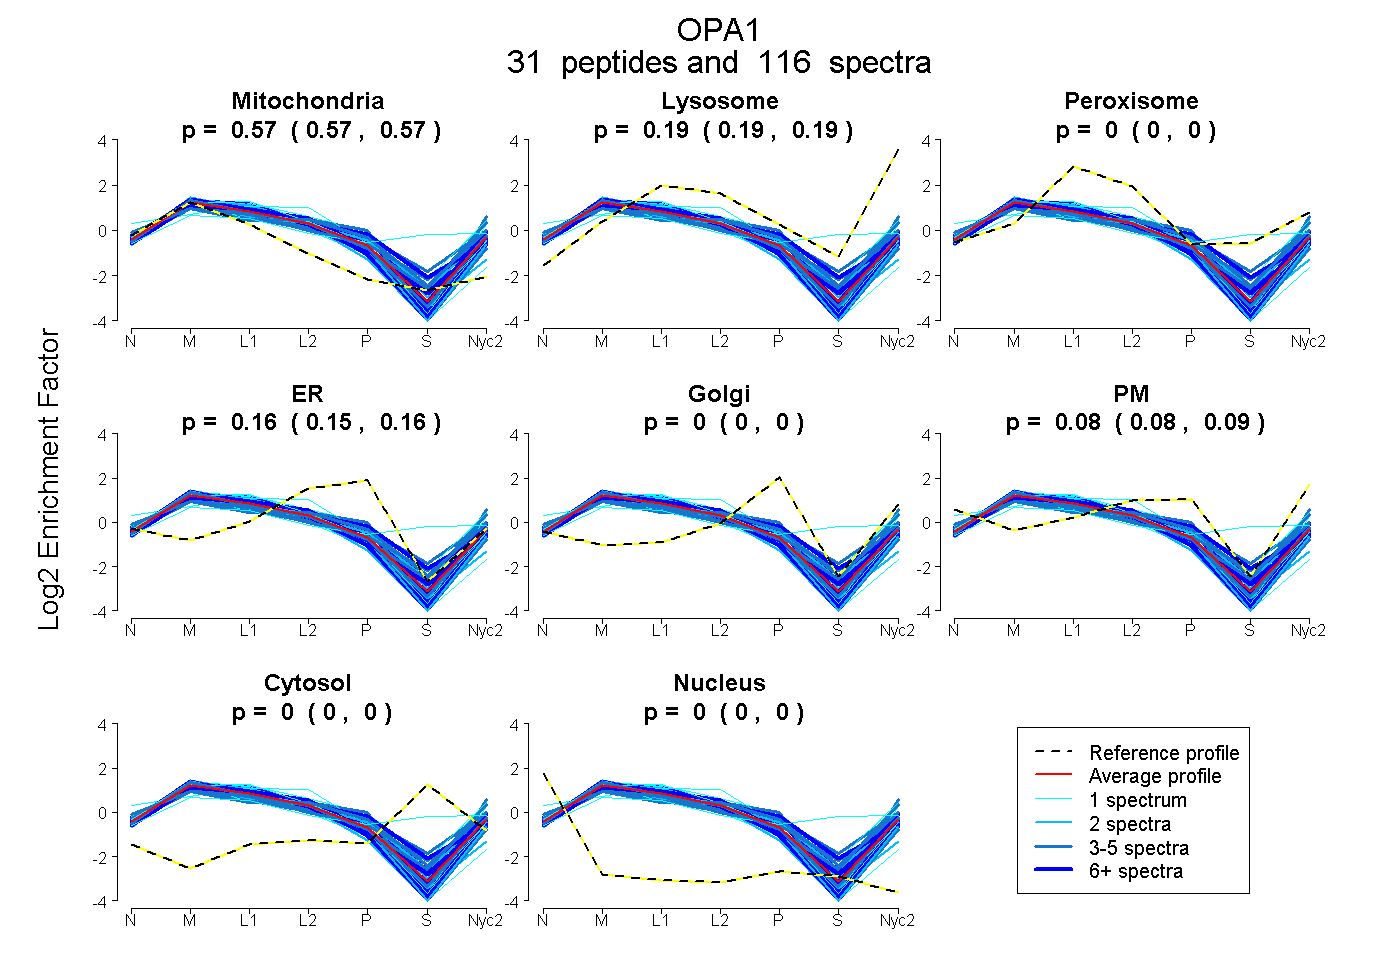
0.567 | 0.570
0.189 | 0.194
0.000 | 0.000
0.153 | 0.160
0.000 | 0.000
0.077 | 0.087
0.000 | 0.000
0.000 | 0.000
22peptides
spectra
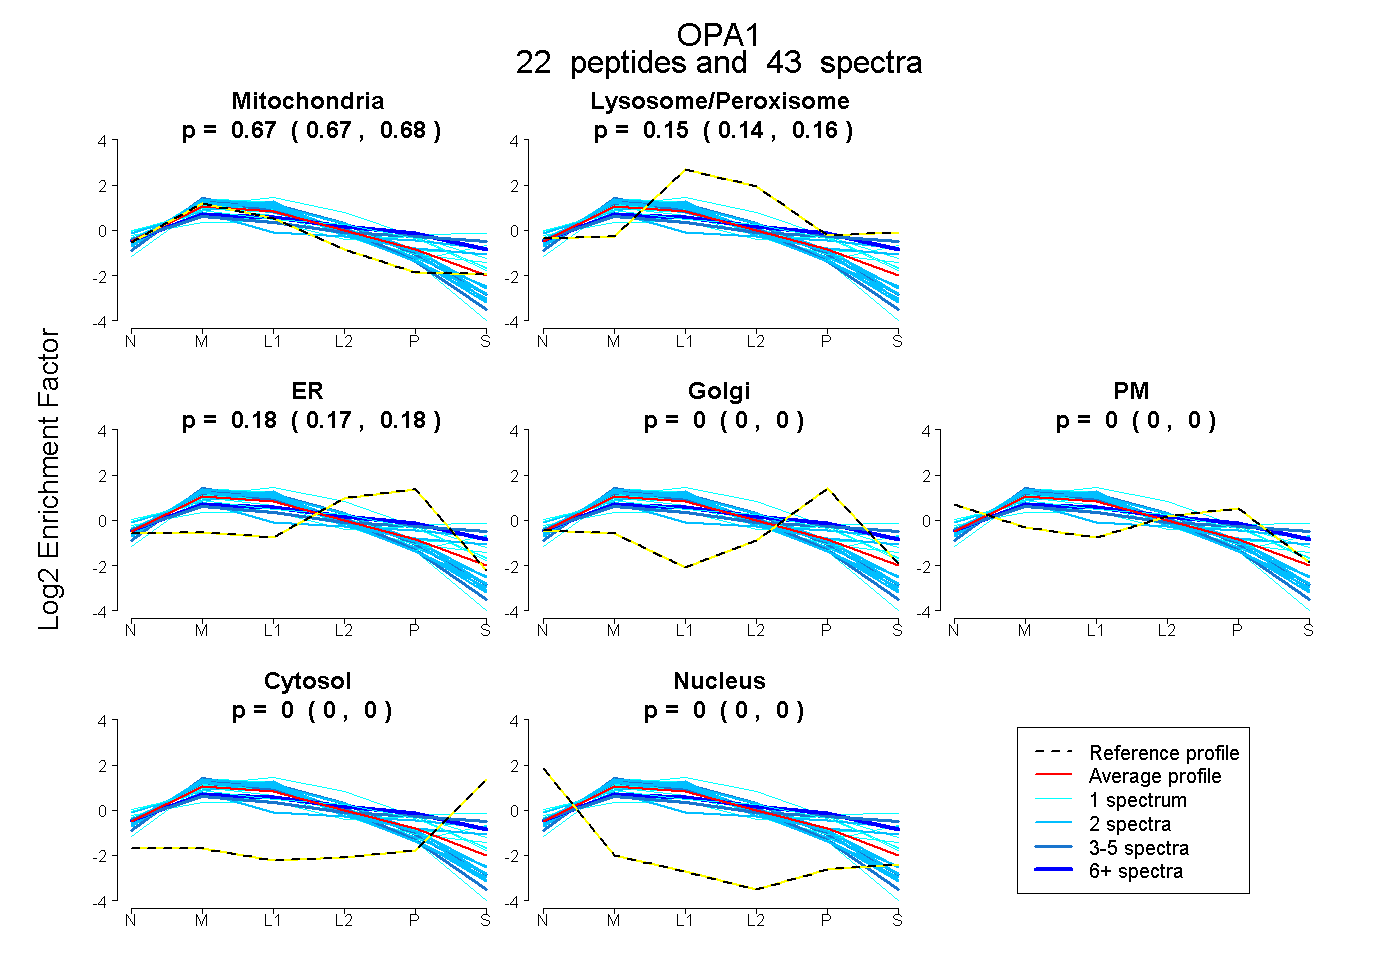
0.667 | 0.680
0.138 | 0.158
0.168 | 0.185
0.000 | 0.000
0.000 | 0.000
0.000 | 0.000
0.000 | 0.000