 31
31peptides
spectra
0.567 | 0.570
0.189 | 0.194
0.000 | 0.000
0.153 | 0.160
0.000 | 0.000
0.077 | 0.087
0.000 | 0.000
0.000 | 0.000
| Plot | Mito | Lyso | Perox | ER | Golgi | PM | Cytosol | Nucleus | |||||
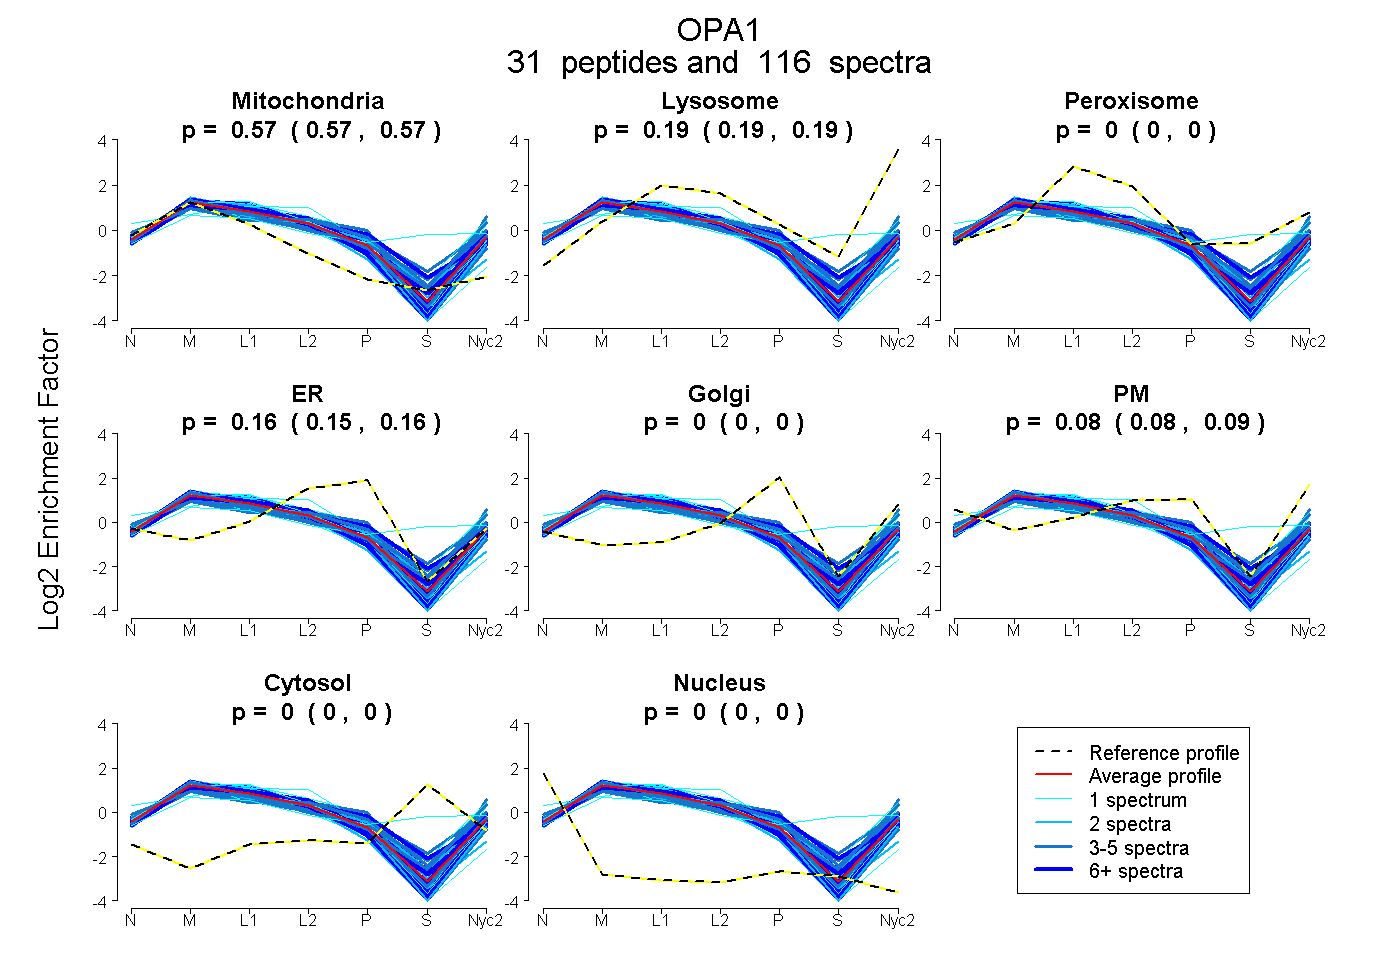
| Expt A |
31 peptides |
116 spectra |
|
0.569 0.567 | 0.570 |
0.191 0.189 | 0.194 |
0.000 0.000 | 0.000 |
0.157 0.153 | 0.160 |
0.000 0.000 | 0.000 |
0.083 0.077 | 0.087 |
0.000 0.000 | 0.000 |
0.000 0.000 | 0.000 |
| 4 spectra, EEDLAALR | 0.466 | 0.205 | 0.107 | 0.000 | 0.211 | 0.011 | 0.000 | 0.000 | ||
| 6 spectra, TALNHCNLCR | 0.474 | 0.150 | 0.123 | 0.253 | 0.000 | 0.000 | 0.000 | 0.000 | ||
| 1 spectrum, EGCTVSPETISLNVK | 0.756 | 0.000 | 0.017 | 0.227 | 0.000 | 0.000 | 0.000 | 0.000 | ||
| 9 spectra, TSVLEMIAQAR | 0.553 | 0.267 | 0.000 | 0.120 | 0.000 | 0.060 | 0.000 | 0.000 | ||
| 4 spectra, QQLTNTEVR | 0.530 | 0.301 | 0.000 | 0.000 | 0.000 | 0.168 | 0.000 | 0.000 | ||
| 1 spectrum, VTLSEGPHHVALFK | 0.292 | 0.128 | 0.278 | 0.000 | 0.051 | 0.000 | 0.251 | 0.000 | ||
| 2 spectra, FNLETEWK | 0.652 | 0.059 | 0.000 | 0.289 | 0.000 | 0.000 | 0.000 | 0.000 | ||
| 1 spectrum, VIQHNALEDR | 0.576 | 0.115 | 0.000 | 0.170 | 0.000 | 0.140 | 0.000 | 0.000 | ||
| 1 spectrum, IAESLSLLK | 0.362 | 0.167 | 0.227 | 0.002 | 0.000 | 0.241 | 0.000 | 0.000 | ||
| 2 spectra, TIFVLTK | 0.613 | 0.112 | 0.000 | 0.198 | 0.000 | 0.078 | 0.000 | 0.000 | ||
| 1 spectrum, DFFTAGTPGETAFR | 0.283 | 0.000 | 0.275 | 0.000 | 0.000 | 0.442 | 0.000 | 0.000 | ||
| 9 spectra, GSGEMMTR | 0.520 | 0.237 | 0.000 | 0.130 | 0.000 | 0.113 | 0.000 | 0.000 | ||
| 6 spectra, ESVEQQADSFK | 0.540 | 0.164 | 0.000 | 0.279 | 0.000 | 0.017 | 0.000 | 0.000 | ||
| 1 spectrum, GFYYYQR | 0.550 | 0.193 | 0.000 | 0.000 | 0.000 | 0.257 | 0.000 | 0.000 | ||
| 1 spectrum, VDLAEK | 0.550 | 0.109 | 0.083 | 0.129 | 0.000 | 0.129 | 0.000 | 0.000 | ||
| 6 spectra, LDAFIEALHQEK | 0.631 | 0.122 | 0.000 | 0.112 | 0.000 | 0.135 | 0.000 | 0.000 | ||
| 2 spectra, EHDDIFDK | 0.656 | 0.183 | 0.000 | 0.161 | 0.000 | 0.000 | 0.000 | 0.000 | ||
| 2 spectra, DTWHQVYR | 0.574 | 0.187 | 0.000 | 0.235 | 0.000 | 0.004 | 0.000 | 0.000 | ||
| 8 spectra, EYEEEFFQNSK | 0.597 | 0.143 | 0.052 | 0.095 | 0.000 | 0.113 | 0.000 | 0.000 | ||
| 2 spectra, IQQIIEGK | 0.669 | 0.160 | 0.000 | 0.052 | 0.000 | 0.118 | 0.000 | 0.000 | ||
| 4 spectra, HEIELR | 0.629 | 0.095 | 0.000 | 0.232 | 0.000 | 0.044 | 0.000 | 0.000 | ||
| 11 spectra, MLAITANTLR | 0.632 | 0.165 | 0.000 | 0.093 | 0.000 | 0.110 | 0.000 | 0.000 | ||
| 3 spectra, ALGYFAVVTGK | 0.587 | 0.116 | 0.000 | 0.066 | 0.000 | 0.230 | 0.000 | 0.000 | ||
| 3 spectra, HWEEILQQSLWER | 0.395 | 0.175 | 0.000 | 0.089 | 0.000 | 0.341 | 0.000 | 0.000 | ||
| 4 spectra, WNDFAEDSLR | 0.581 | 0.201 | 0.000 | 0.121 | 0.000 | 0.097 | 0.000 | 0.000 | ||
| 3 spectra, GNSSESIEAIR | 0.609 | 0.163 | 0.000 | 0.146 | 0.000 | 0.082 | 0.000 | 0.000 | ||
| 6 spectra, AVEVAWETLQDEFSR | 0.623 | 0.172 | 0.000 | 0.172 | 0.000 | 0.033 | 0.000 | 0.000 | ||
| 5 spectra, SIVTDLVSQMDPHGR | 0.556 | 0.133 | 0.073 | 0.122 | 0.000 | 0.116 | 0.000 | 0.000 | ||
| 2 spectra, NVASPSR | 0.536 | 0.231 | 0.000 | 0.212 | 0.000 | 0.021 | 0.000 | 0.000 | ||
| 2 spectra, EVLEDFAEDGEK | 0.580 | 0.112 | 0.000 | 0.159 | 0.000 | 0.148 | 0.000 | 0.000 | ||
| 4 spectra, VNDEHPAYLASDEITTVR | 0.458 | 0.143 | 0.012 | 0.124 | 0.000 | 0.263 | 0.000 | 0.000 |
| Plot | Mito | Lyso or Perox | ER | Golgi | PM | Cytosol | Nucleus | ||||||
| Expt B |
22 peptides |
43 spectra |
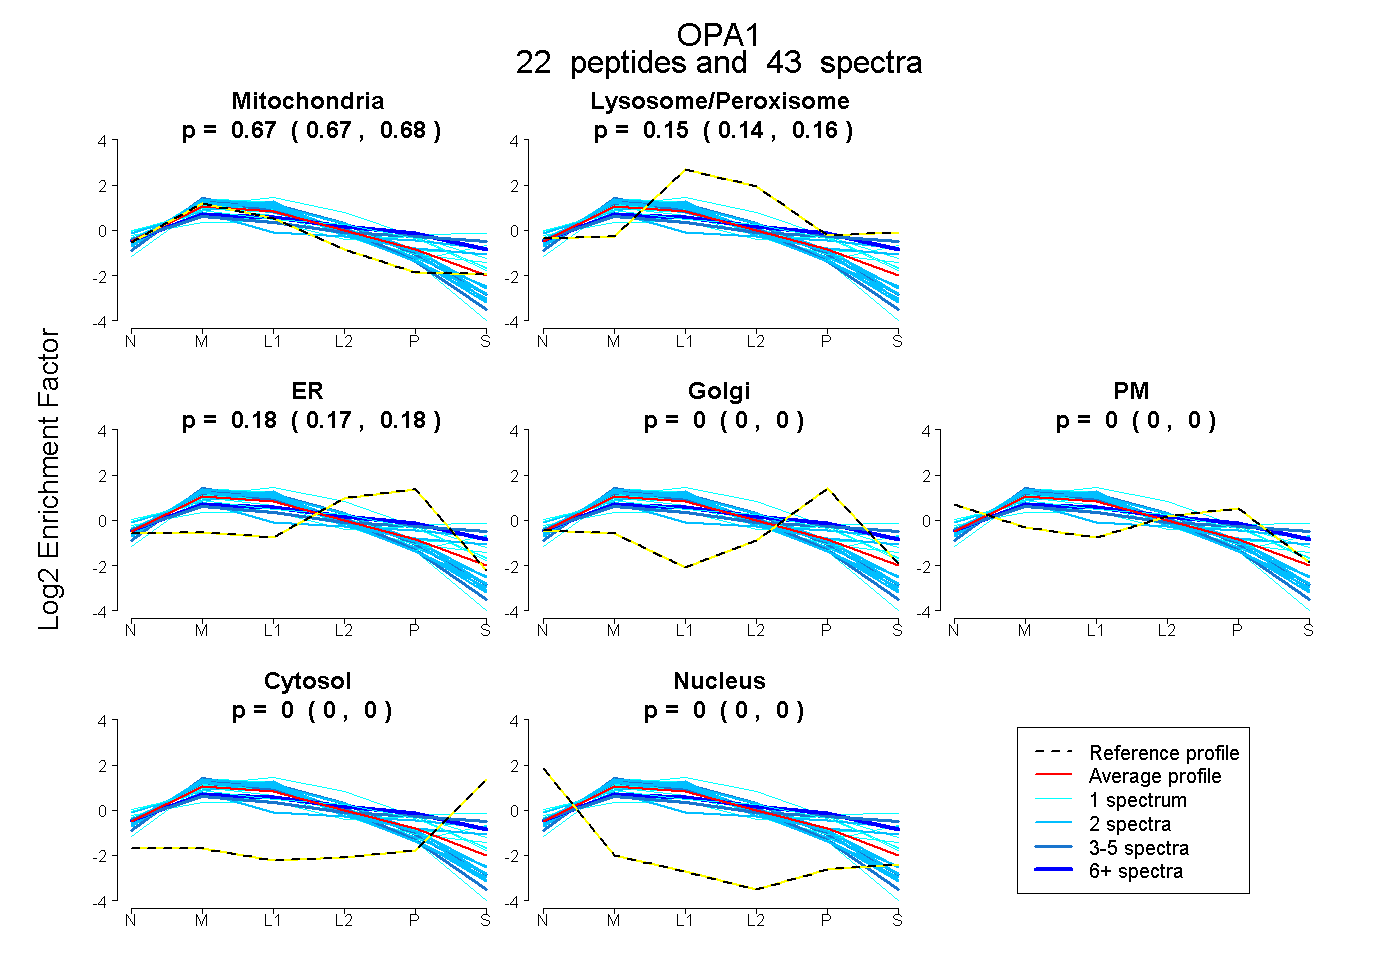 |
0.674 0.667 | 0.680 |
0.149 0.138 | 0.158 |
0.177 0.168 | 0.185 |
0.000 0.000 | 0.000 |
0.000 0.000 | 0.000 |
0.000 0.000 | 0.000 |
0.000 0.000 | 0.000 |
|||
| Plot | Lyso | Other | |||||||||||
| Expt C |
43 peptides |
354 spectra |
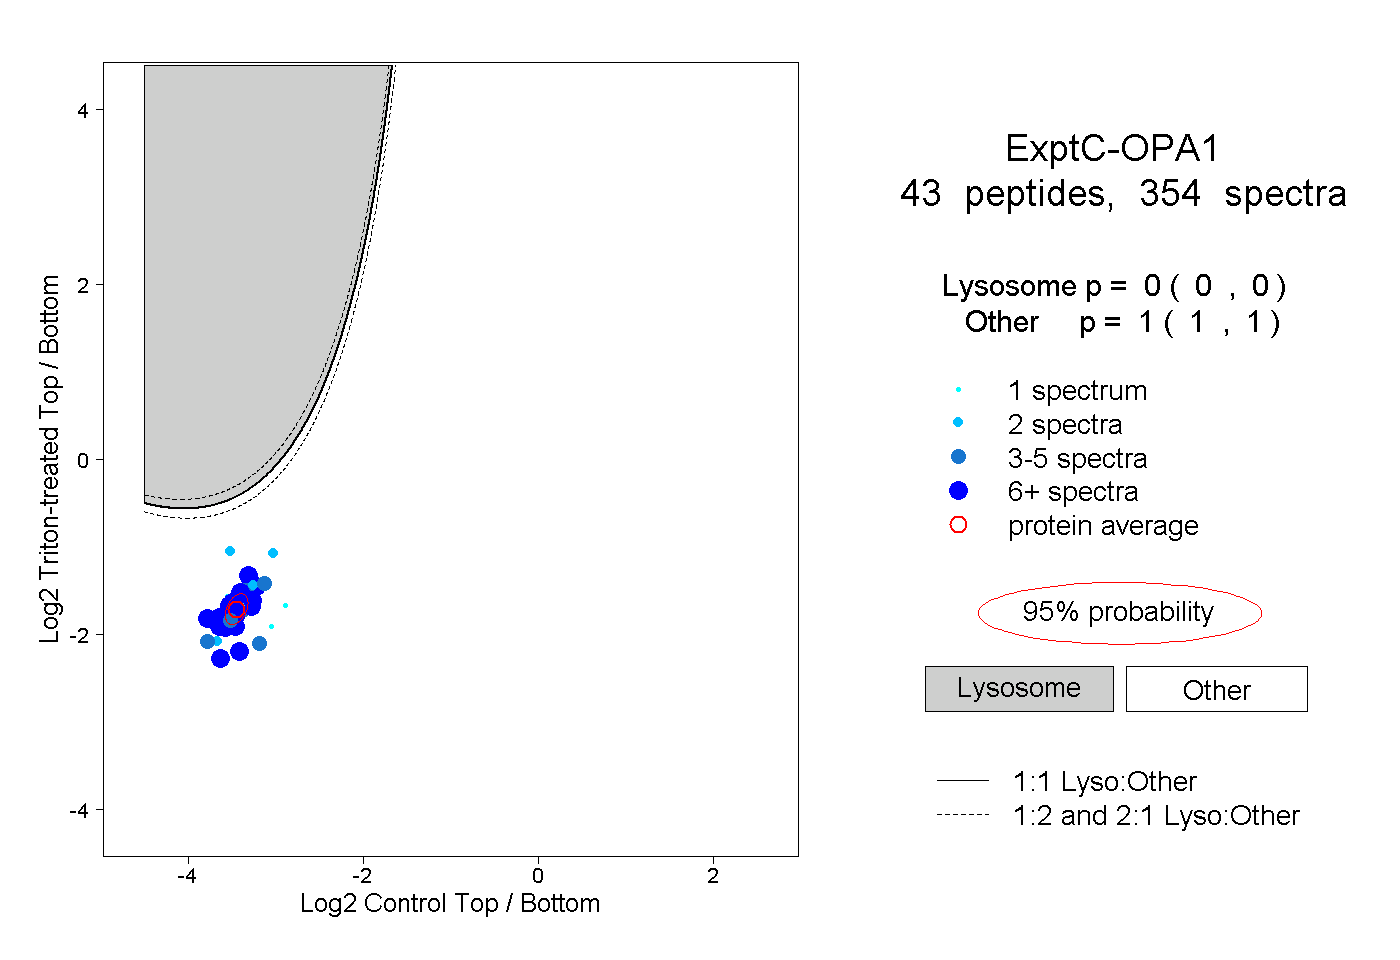 |
0.000 0.000 | 0.000 |
1.000 1.000 | 1.000 |
||||||||
| Plot | Lyso | Other | |||||||||||
| Expt D |
17 peptides |
35 spectra |
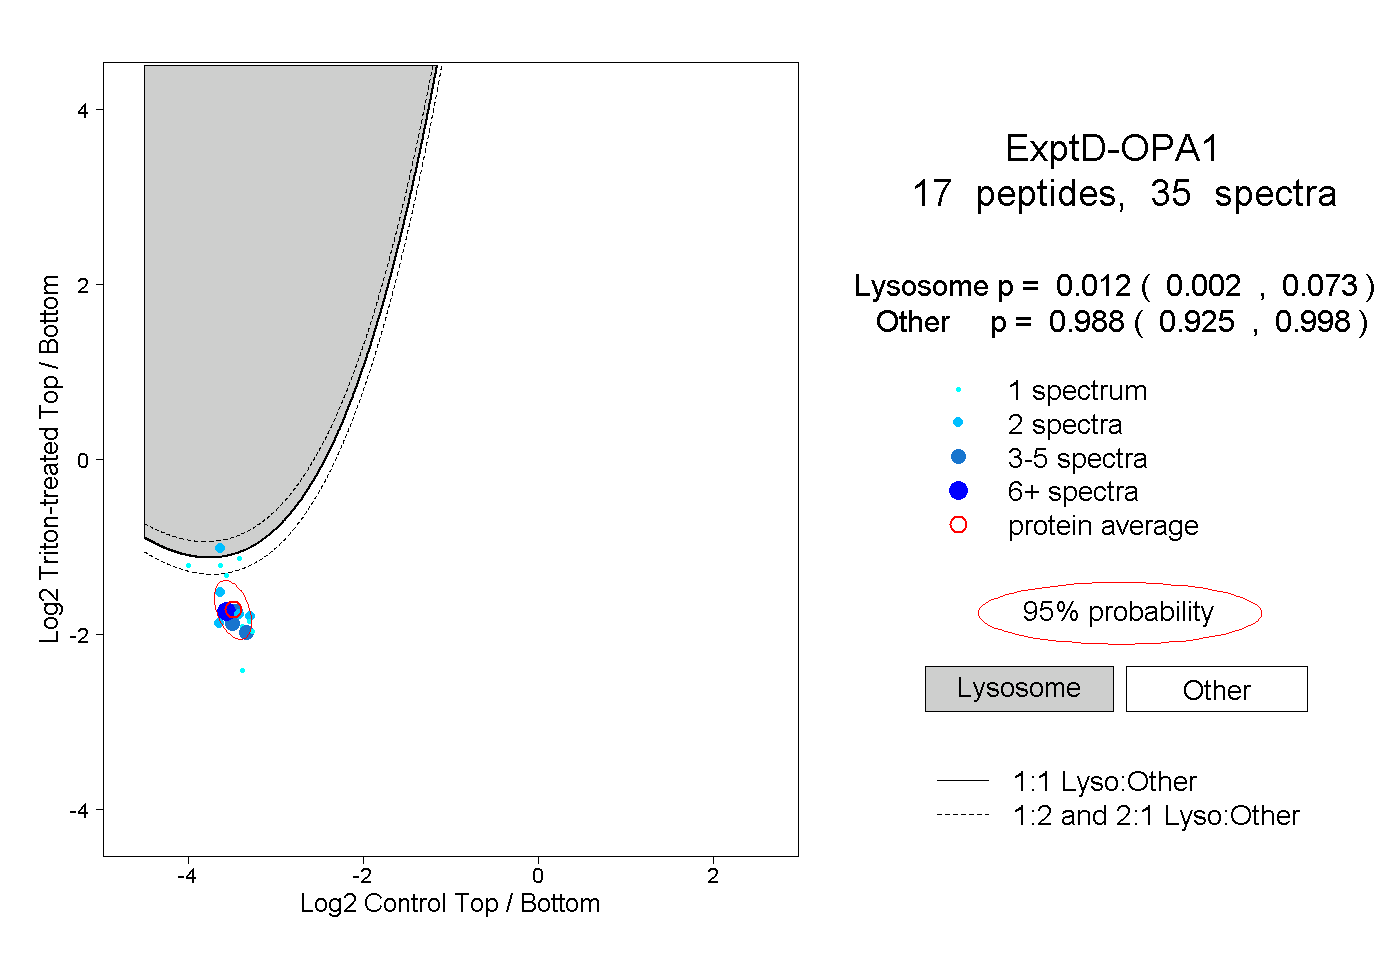 |
0.012 0.002 | 0.073 |
0.988 0.925 | 0.998 |