 30
30peptides
spectra
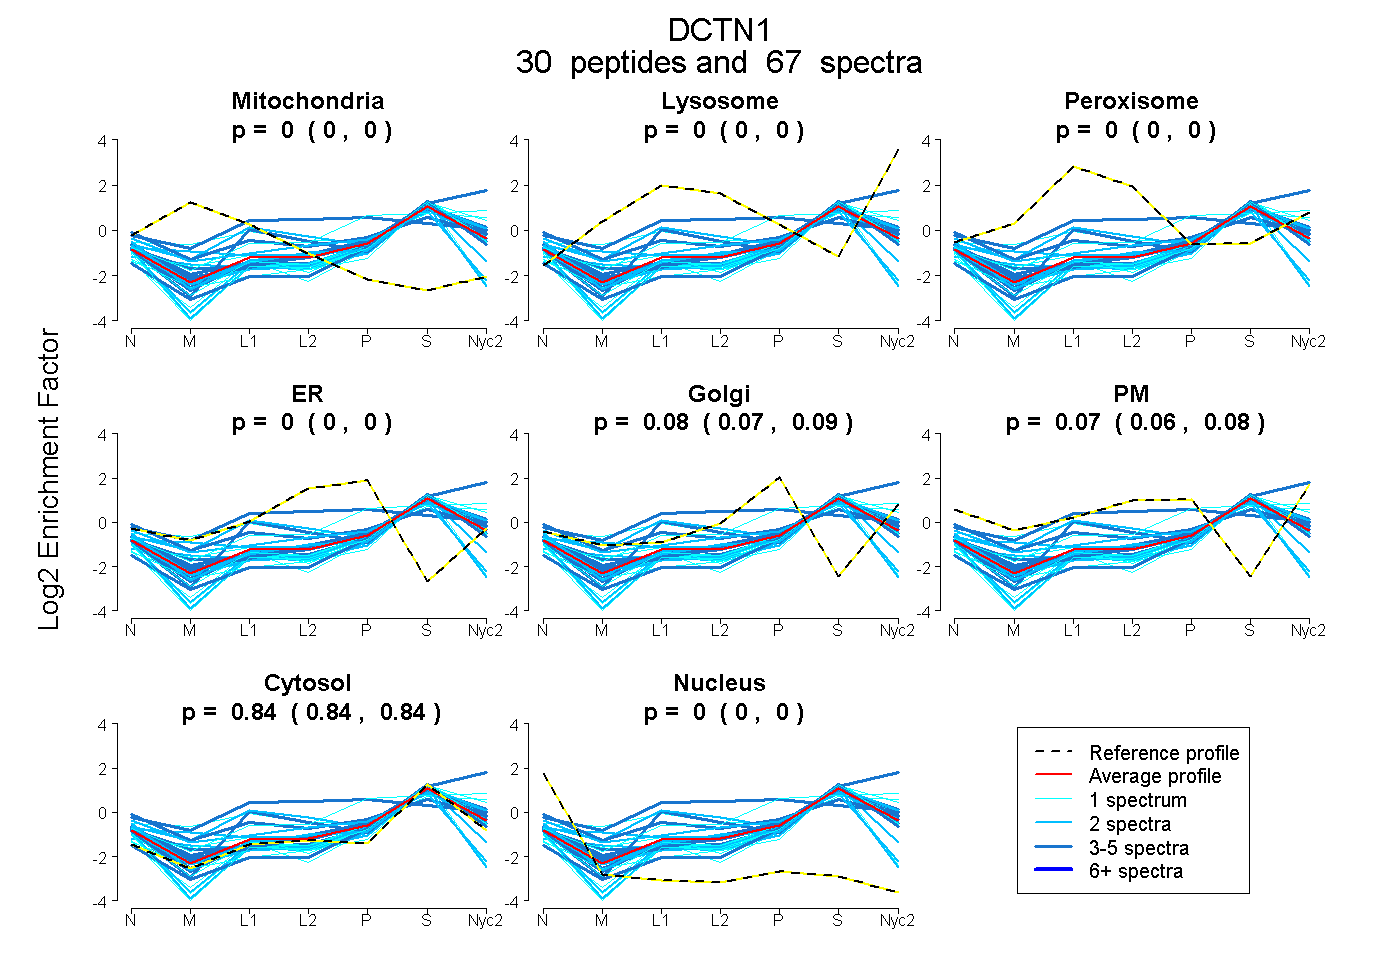
0.000 | 0.000
0.000 | 0.000
0.000 | 0.000
0.000 | 0.000
0.073 | 0.093
0.063 | 0.084
0.839 | 0.845
0.000 | 0.000
10peptides
spectra
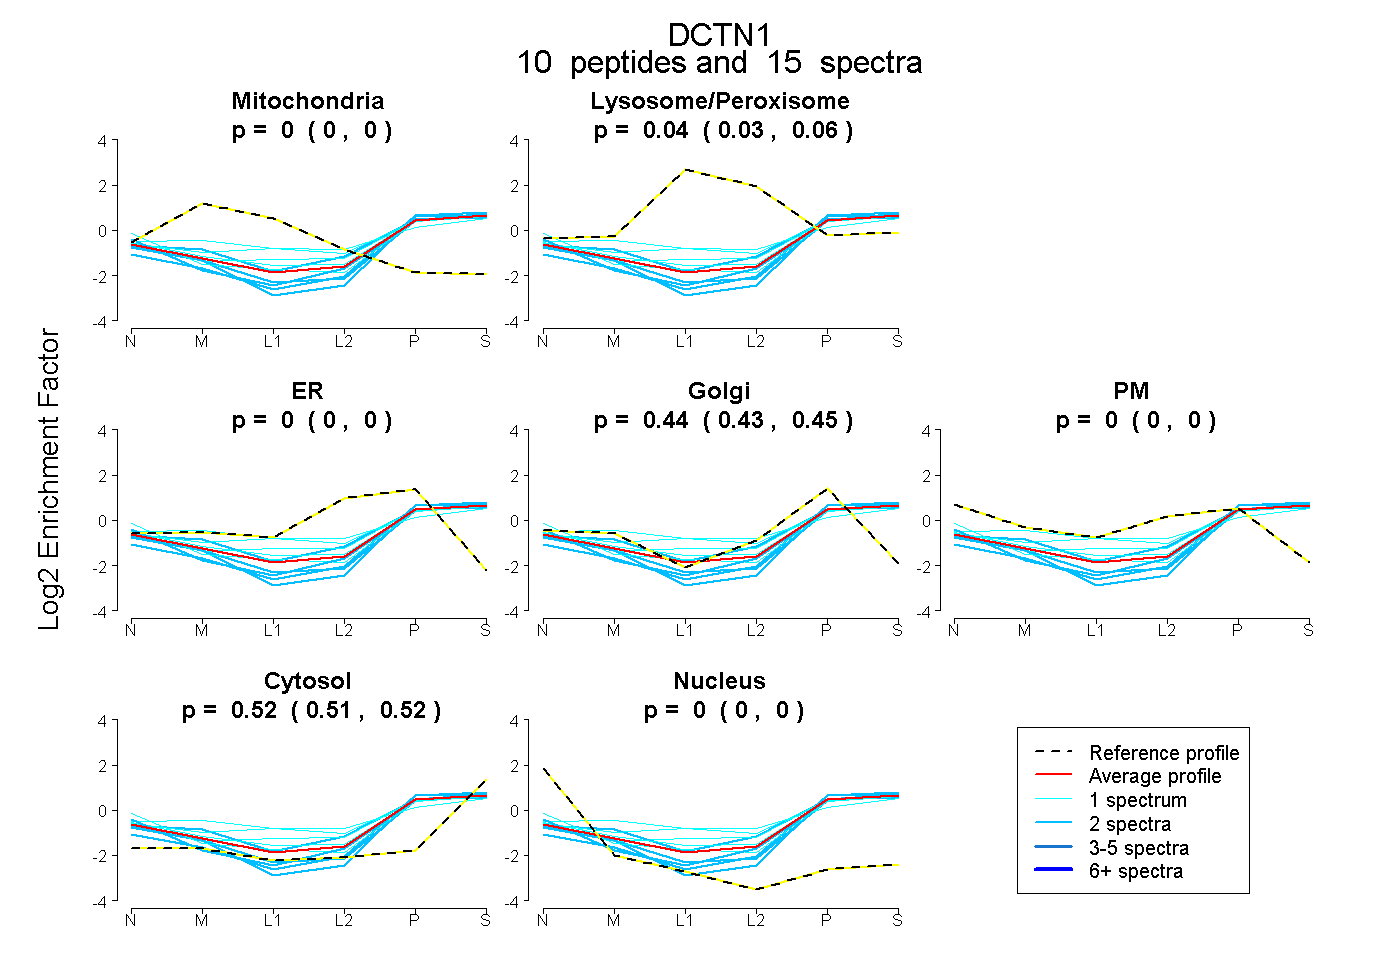
0.000 | 0.000
0.027 | 0.060
0.000 | 0.000
0.428 | 0.449
0.000 | 0.000
0.506 | 0.523
0.000 | 0.000
21peptides
spectra
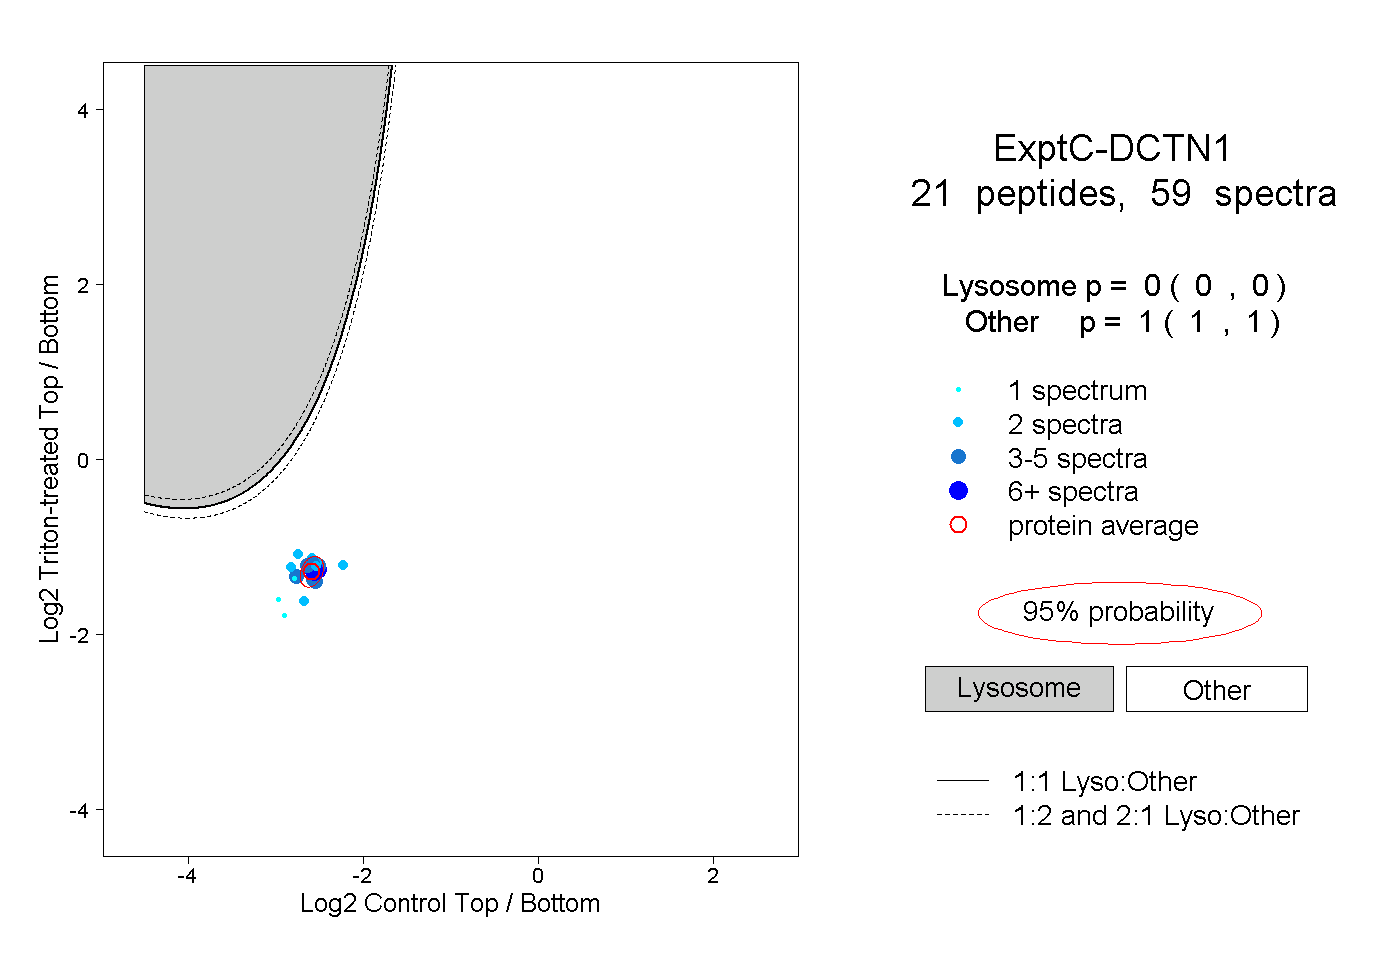
0.000 | 0.000
1.000 | 1.000
4peptides
spectra
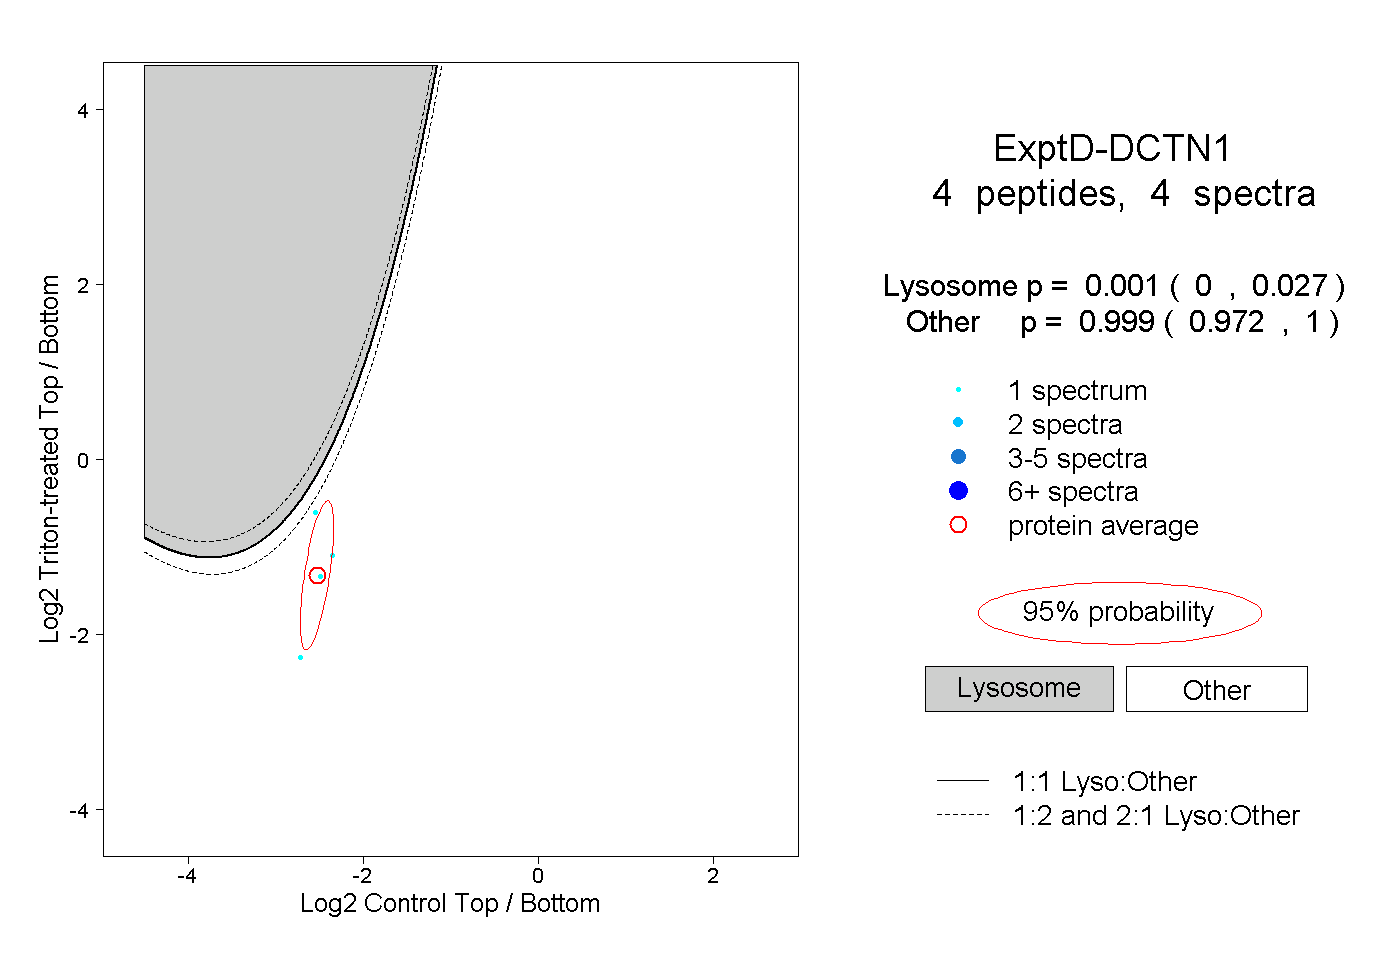
0.000 | 0.027
0.972 | 1.000