 1
1peptide
spectra
0.000 | 0.034
0.000 | 0.000
0.000 | 0.000
0.221 | 0.488
0.000 | 0.225
0.000 | 0.000
0.226 | 0.270
0.224 | 0.303
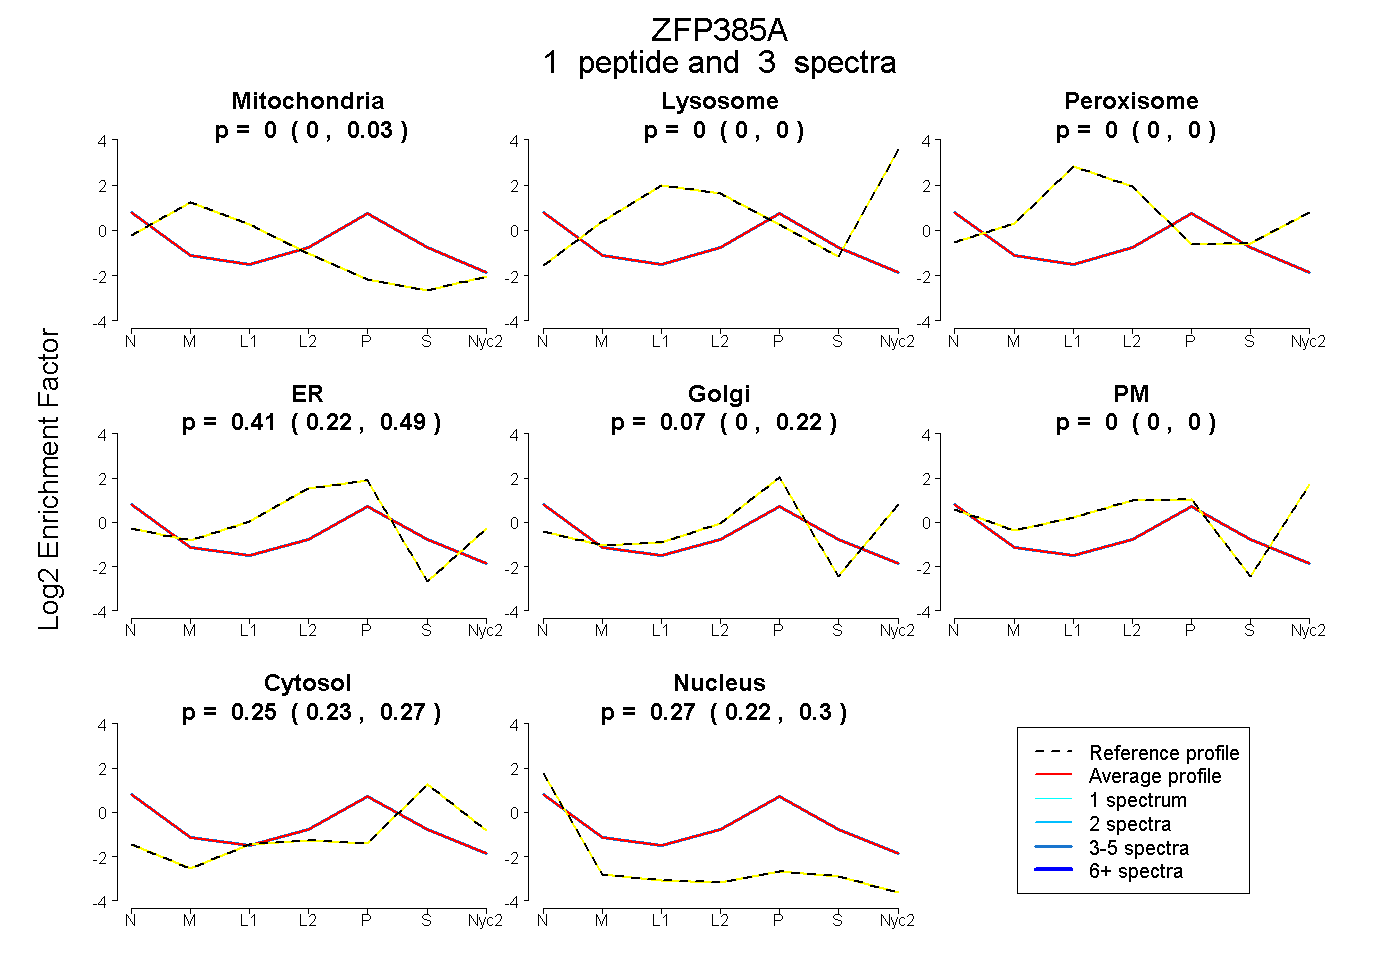
| Plot | Mito | Lyso | Perox | ER | Golgi | PM | Cytosol | Nucleus | |||||
| Expt A |
1 peptide |
3 spectra |
|
0.000 0.000 | 0.034 |
0.000 0.000 | 0.000 |
0.000 0.000 | 0.000 |
0.409 0.221 | 0.488 |
0.066 0.000 | 0.225 |
0.000 0.000 | 0.000 |
0.254 0.226 | 0.270 |
0.271 0.224 | 0.303 |
| 3 spectra, AVLSHTFGGPLLK | 0.000 | 0.000 | 0.000 | 0.409 | 0.066 | 0.000 | 0.254 | 0.271 |