 16
16peptides
spectra
0.000 | 0.000
0.000 | 0.000
0.000 | 0.000
0.115 | 0.131
0.482 | 0.501
0.000 | 0.000
0.355 | 0.360
0.024 | 0.029
| Plot | Mito | Lyso | Perox | ER | Golgi | PM | Cytosol | Nucleus | |||||
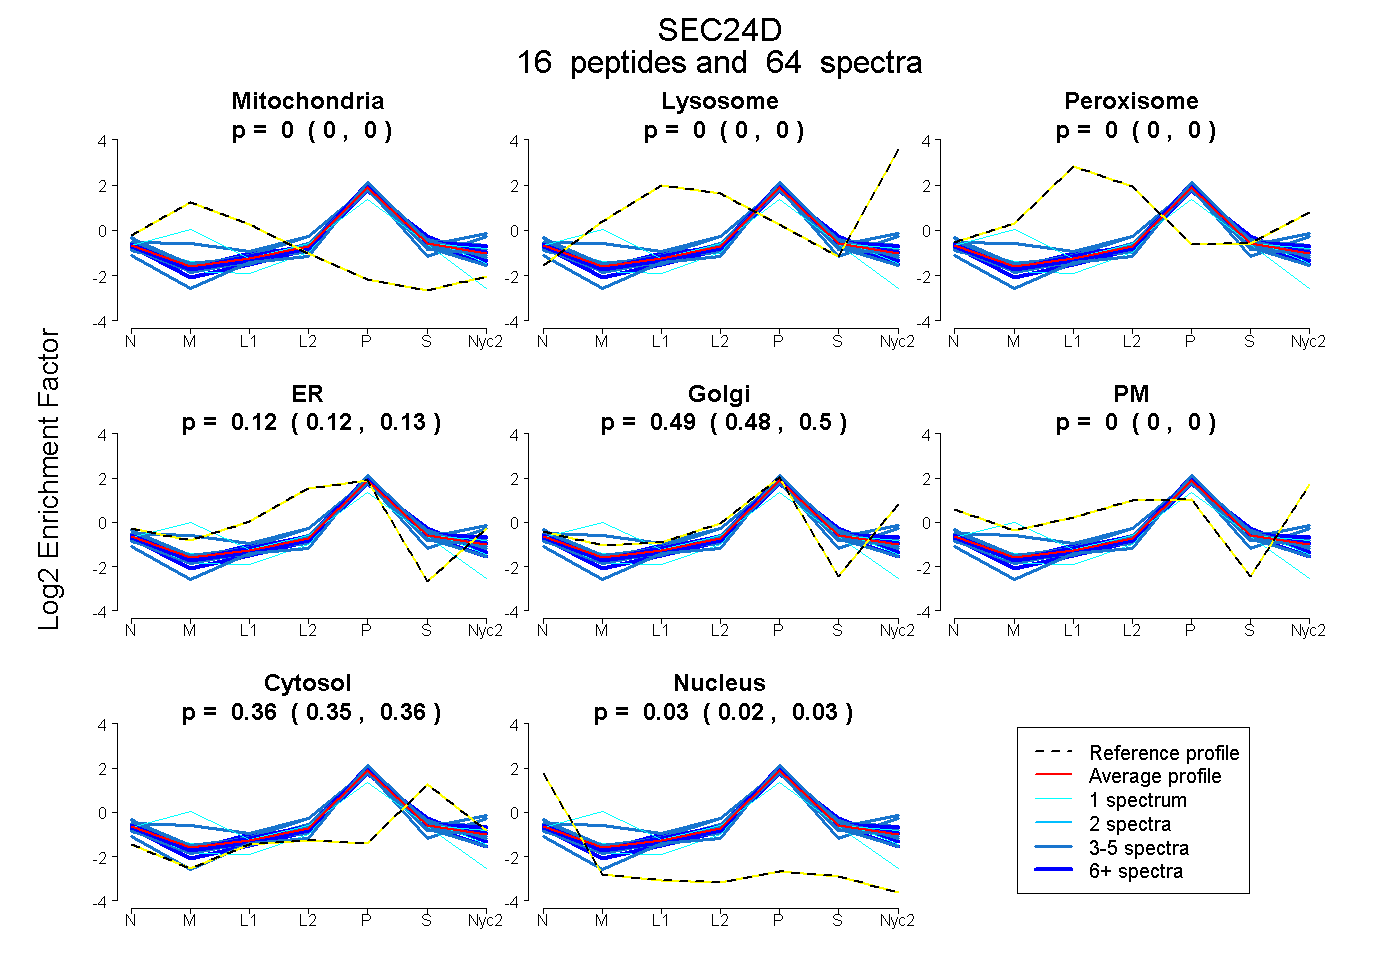
| Expt A |
16 peptides |
64 spectra |
|
0.000 0.000 | 0.000 |
0.000 0.000 | 0.000 |
0.000 0.000 | 0.000 |
0.124 0.115 | 0.131 |
0.492 0.482 | 0.501 |
0.000 0.000 | 0.000 |
0.358 0.355 | 0.360 |
0.026 0.024 | 0.029 |
| 1 spectrum, NCVLLSRPEISPDER | 0.000 | 0.000 | 0.000 | 0.447 | 0.065 | 0.000 | 0.332 | 0.155 | ||
| 3 spectra, VLPVYMNSLLK | 0.000 | 0.000 | 0.000 | 0.000 | 0.551 | 0.000 | 0.427 | 0.022 | ||
| 1 spectrum, ILFQPQTAVYESLAK | 0.000 | 0.000 | 0.000 | 0.011 | 0.524 | 0.000 | 0.384 | 0.082 | ||
| 4 spectra, MIMNNIQQK | 0.000 | 0.000 | 0.000 | 0.210 | 0.423 | 0.000 | 0.367 | 0.000 | ||
| 6 spectra, AAECPGK | 0.000 | 0.000 | 0.000 | 0.129 | 0.441 | 0.000 | 0.350 | 0.080 | ||
| 9 spectra, SAALPPAVR | 0.000 | 0.000 | 0.000 | 0.082 | 0.555 | 0.000 | 0.364 | 0.000 | ||
| 1 spectrum, YNVFQVHVDSQR | 0.156 | 0.000 | 0.000 | 0.061 | 0.511 | 0.000 | 0.272 | 0.000 | ||
| 3 spectra, AVTVEFK | 0.000 | 0.000 | 0.000 | 0.099 | 0.510 | 0.000 | 0.354 | 0.037 | ||
| 3 spectra, FLNDLR | 0.038 | 0.000 | 0.000 | 0.156 | 0.610 | 0.000 | 0.196 | 0.000 | ||
| 5 spectra, QFLVEDK | 0.000 | 0.000 | 0.000 | 0.181 | 0.396 | 0.000 | 0.389 | 0.035 | ||
| 4 spectra, VGFITYNK | 0.000 | 0.000 | 0.000 | 0.146 | 0.498 | 0.000 | 0.283 | 0.073 | ||
| 6 spectra, VLHFFNVK | 0.000 | 0.000 | 0.000 | 0.052 | 0.560 | 0.000 | 0.365 | 0.022 | ||
| 5 spectra, IGFDAIMR | 0.000 | 0.000 | 0.000 | 0.000 | 0.694 | 0.000 | 0.306 | 0.000 | ||
| 4 spectra, KPYSMK | 0.000 | 0.000 | 0.000 | 0.087 | 0.507 | 0.000 | 0.370 | 0.037 | ||
| 3 spectra, AYMCPFMQFIEGGR | 0.000 | 0.000 | 0.000 | 0.194 | 0.407 | 0.000 | 0.334 | 0.065 | ||
| 6 spectra, EILVNQTAHMLACYR | 0.000 | 0.000 | 0.000 | 0.220 | 0.321 | 0.000 | 0.432 | 0.027 |
| Plot | Mito | Lyso or Perox | ER | Golgi | PM | Cytosol | Nucleus | ||||||
| Expt B |
9 peptides |
30 spectra |
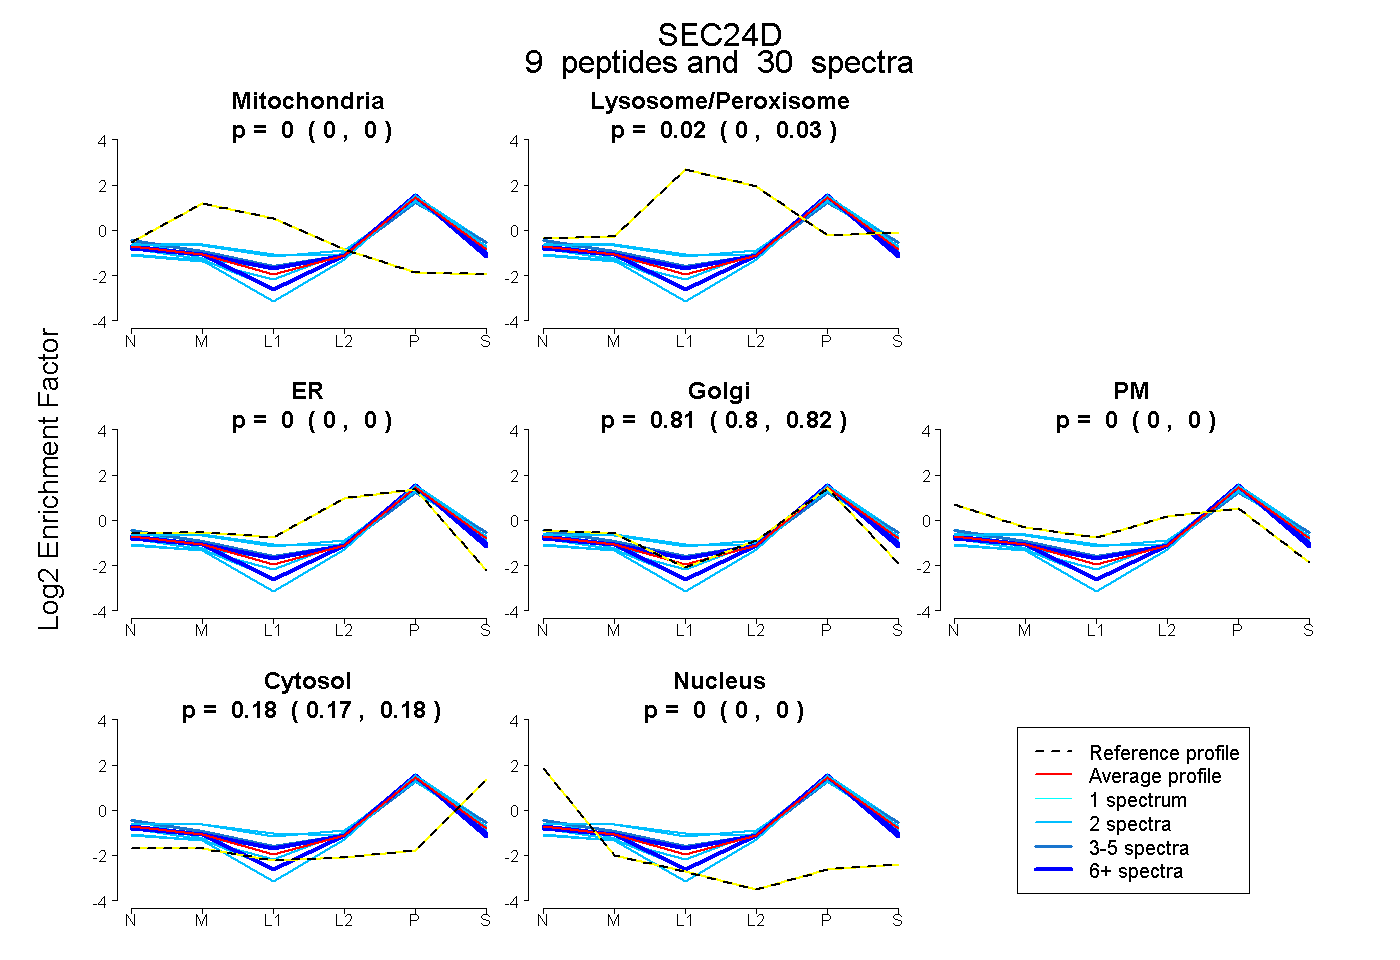 |
0.000 0.000 | 0.000 |
0.015 0.005 | 0.026 |
0.000 0.000 | 0.000 |
0.808 0.798 | 0.815 |
0.000 0.000 | 0.000 |
0.177 0.171 | 0.181 |
0.000 0.000 | 0.000 |
|||
| Plot | Lyso | Other | |||||||||||
| Expt C |
19 peptides |
80 spectra |
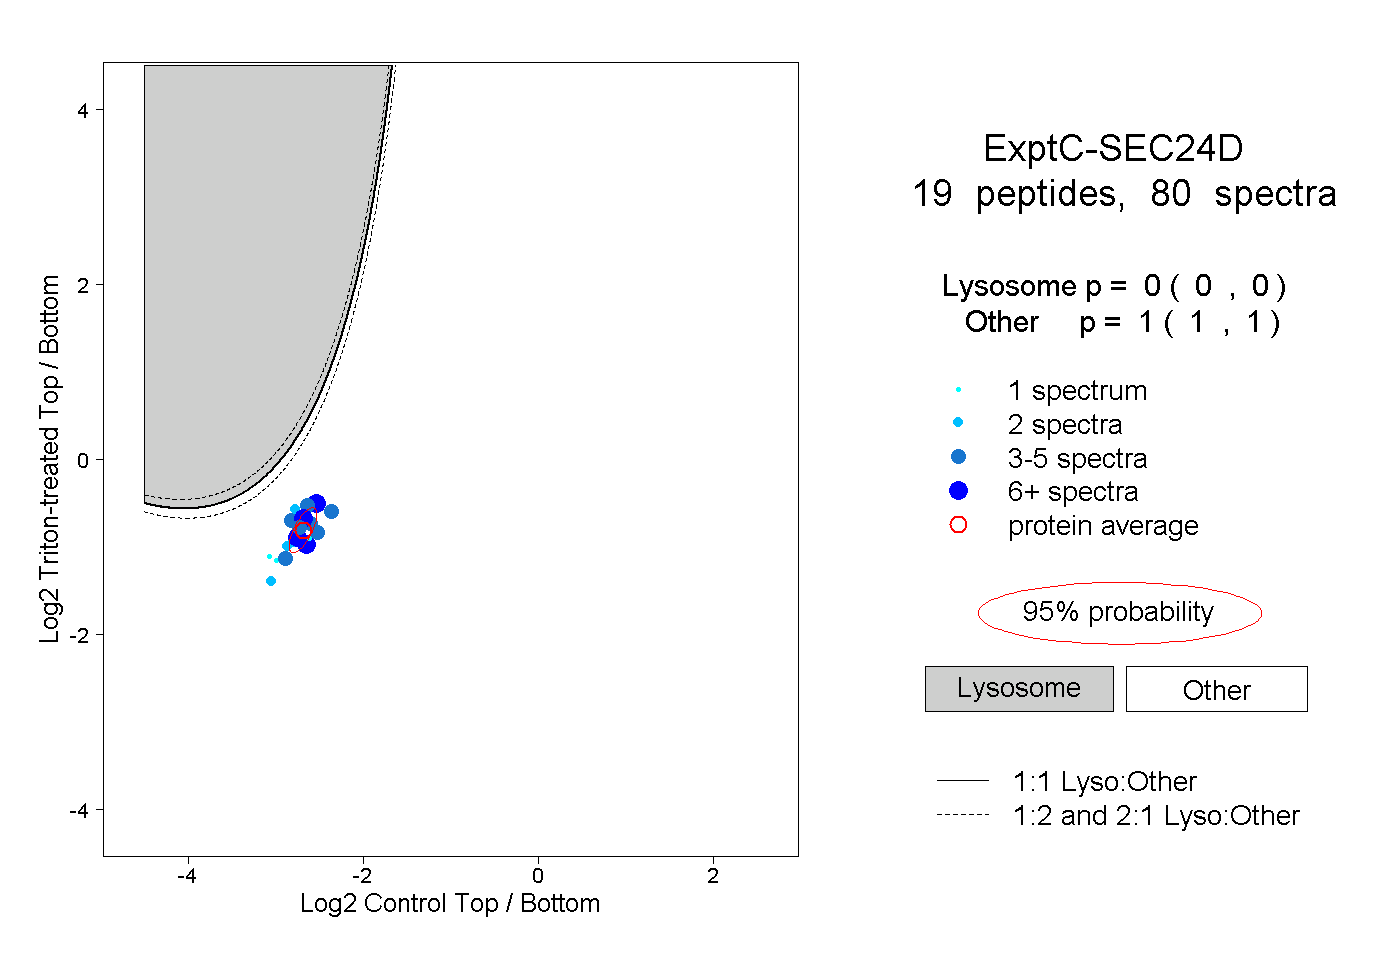 |
0.000 0.000 | 0.000 |
1.000 1.000 | 1.000 |
||||||||
| Plot | Lyso | Other | |||||||||||
| Expt D |
4 peptides |
4 spectra |
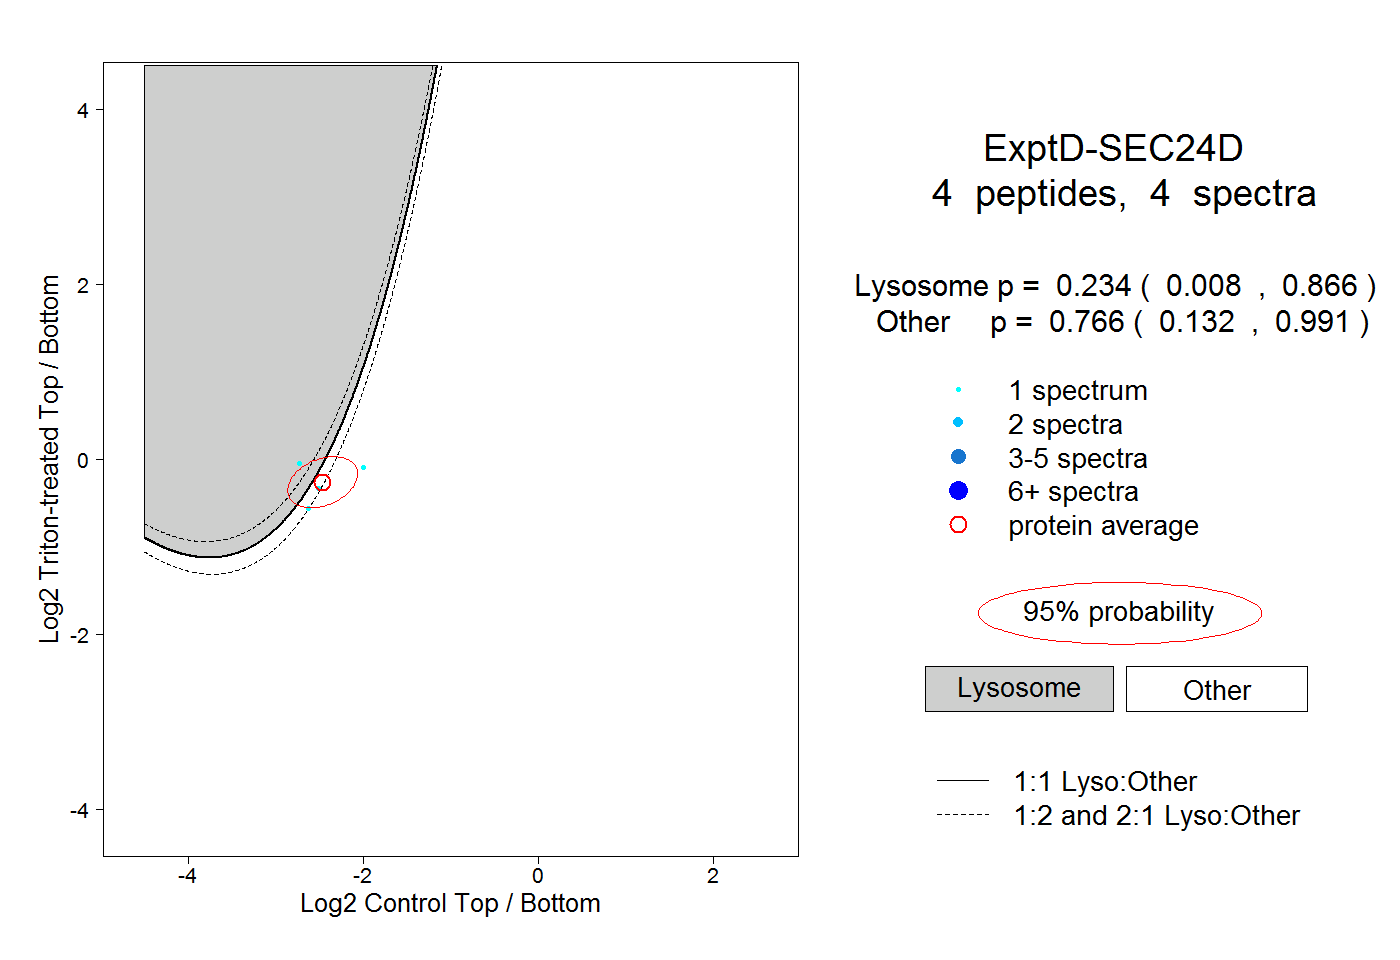 |
0.234 0.008 | 0.866 |
0.766 0.132 | 0.991 |