 2
2peptides
spectra
0.000 | 0.097
0.372 | 0.635
0.000 | 0.148
0.000 | 0.000
0.000 | 0.058
0.084 | 0.261
0.090 | 0.272
0.000 | 0.071
6peptides
spectra
0.000 | 0.518
0.482 | 1.000
| Plot | Mito | Lyso | Perox | ER | Golgi | PM | Cytosol | Nucleus | |||||
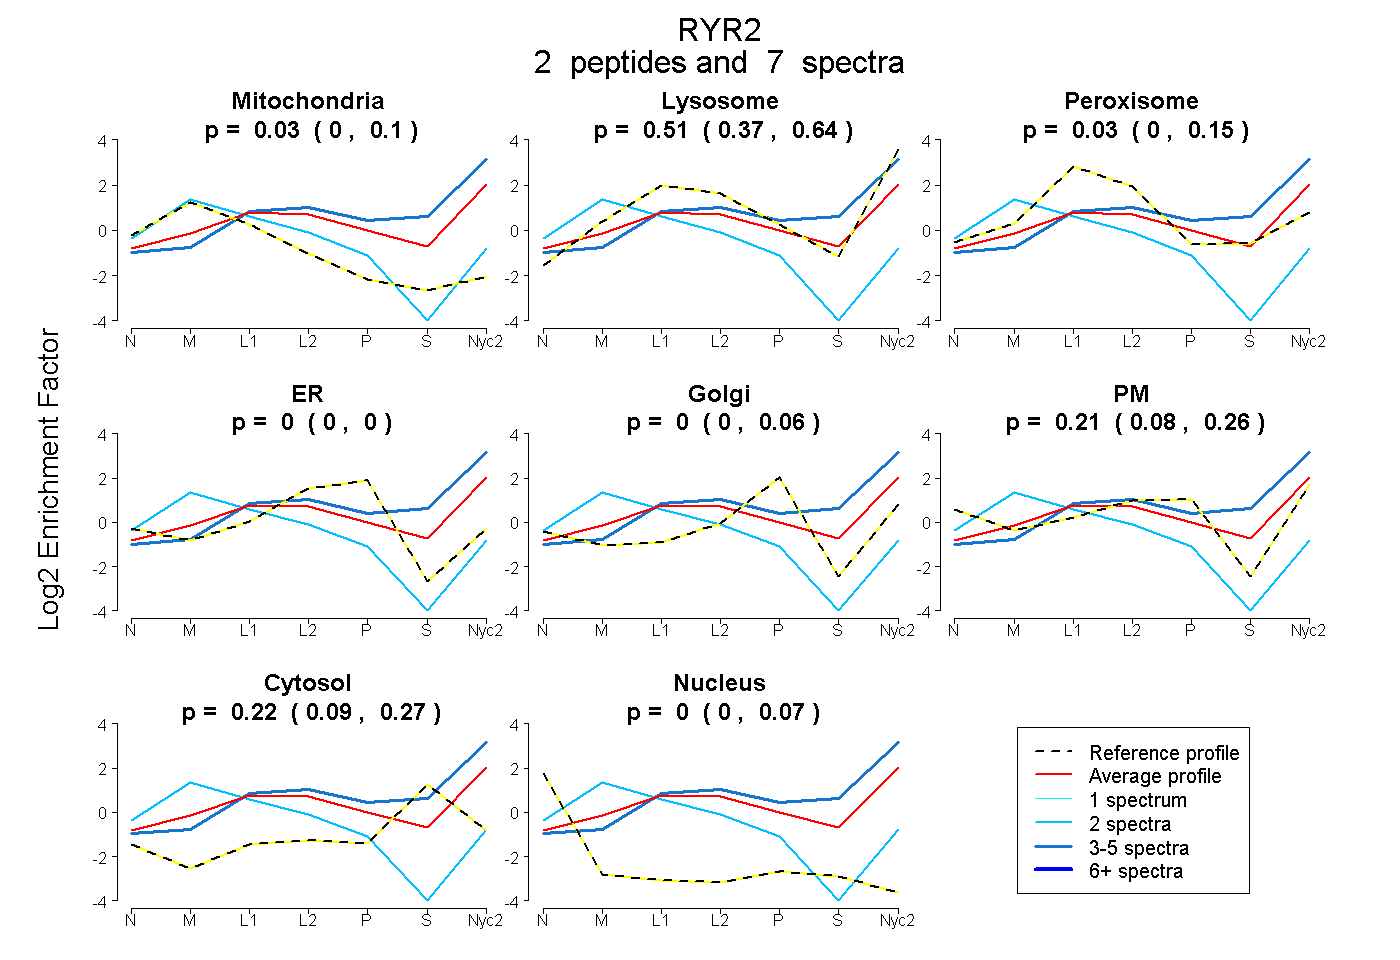
| Expt A |
2 peptides |
7 spectra |
|
0.031 0.000 | 0.097 |
0.508 0.372 | 0.635 |
0.034 0.000 | 0.148 |
0.000 0.000 | 0.000 |
0.000 0.000 | 0.058 |
0.210 0.084 | 0.261 |
0.217 0.090 | 0.272 |
0.000 0.000 | 0.071 |
||
| Plot | Lyso | Other | |||||||||||
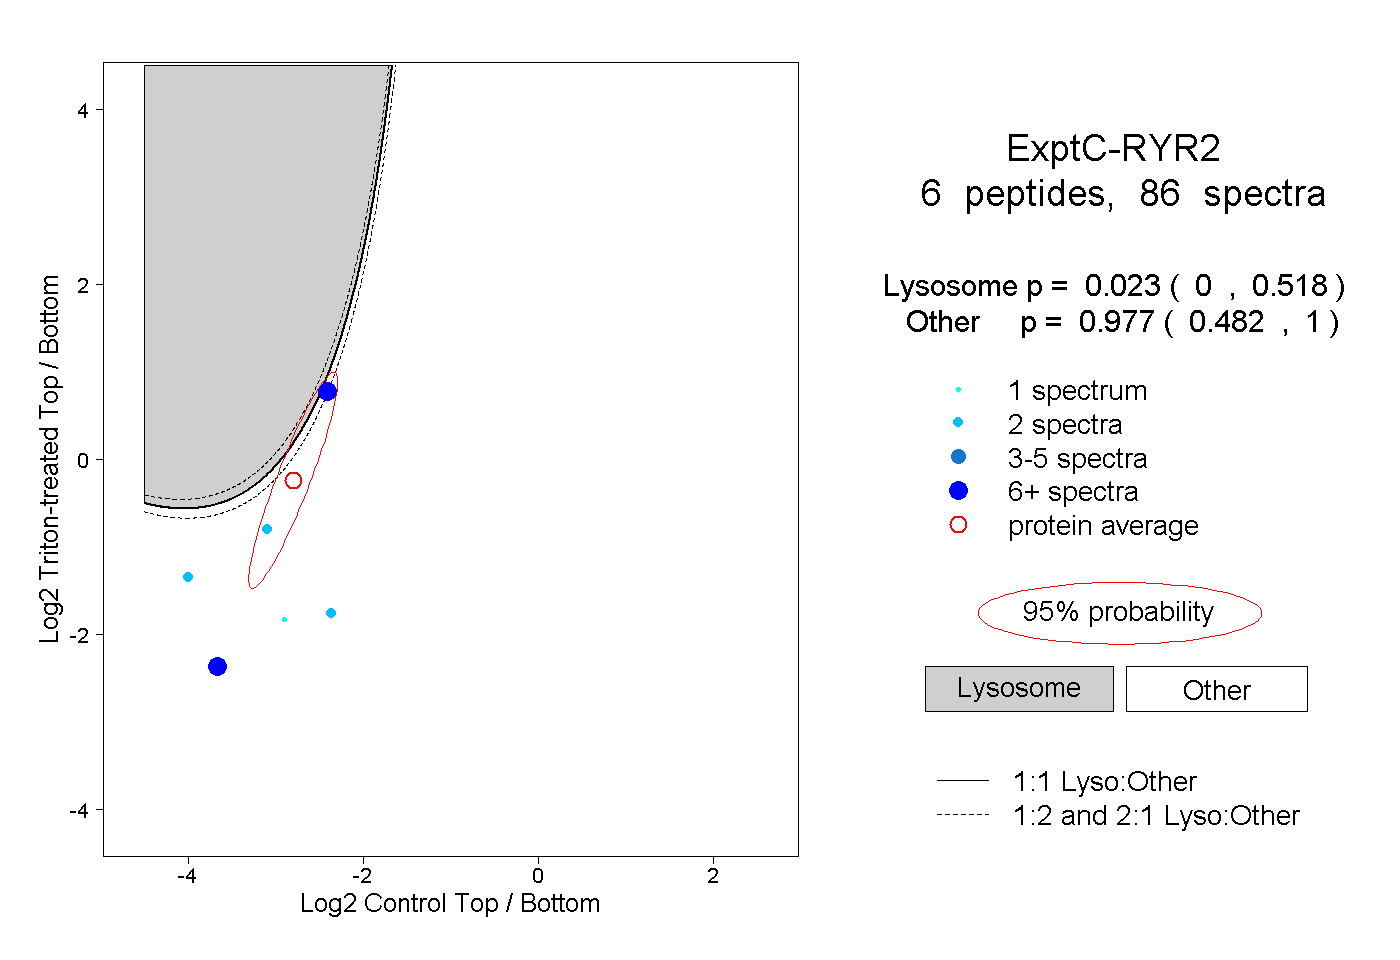
| Expt C |
6 peptides |
86 spectra |
|
0.023 0.000 | 0.518 |
0.977 0.482 | 1.000 |