 6
6peptides
spectra
0.000 | 0.025
0.098 | 0.179
0.000 | 0.070
0.000 | 0.000
0.000 | 0.094
0.691 | 0.813
0.000 | 0.047
0.000 | 0.000
| Plot | Mito | Lyso | Perox | ER | Golgi | PM | Cytosol | Nucleus | |||||
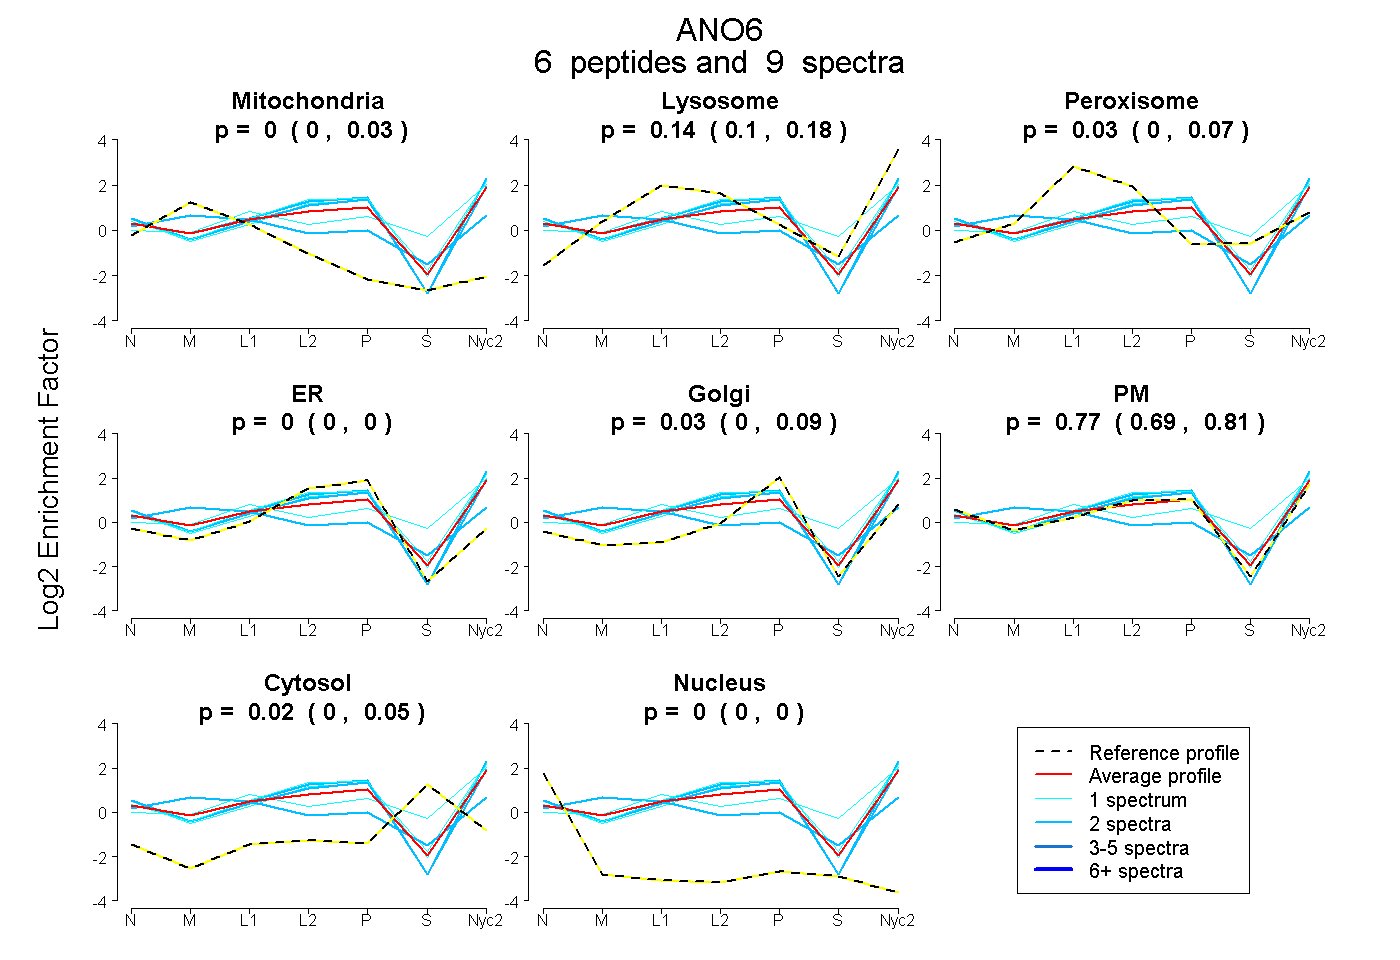
| Expt A |
6 peptides |
9 spectra |
|
0.000 0.000 | 0.025 |
0.140 0.098 | 0.179 |
0.029 0.000 | 0.070 |
0.000 0.000 | 0.000 |
0.034 0.000 | 0.094 |
0.774 0.691 | 0.813 |
0.023 0.000 | 0.047 |
0.000 0.000 | 0.000 |
| 2 spectra, LCPFWR | 0.000 | 0.011 | 0.000 | 0.003 | 0.000 | 0.986 | 0.000 | 0.000 | ||
| 1 spectrum, TPEFEEFNGKPDSLFFTDGQR | 0.000 | 0.172 | 0.000 | 0.022 | 0.000 | 0.806 | 0.000 | 0.000 | ||
| 2 spectra, QAYESNLISHGLQLEATR | 0.328 | 0.163 | 0.016 | 0.000 | 0.000 | 0.424 | 0.068 | 0.000 | ||
| 1 spectrum, YQVMNNVNK | 0.000 | 0.358 | 0.059 | 0.000 | 0.000 | 0.371 | 0.212 | 0.000 | ||
| 2 spectra, MNDFYILDR | 0.000 | 0.125 | 0.000 | 0.000 | 0.000 | 0.875 | 0.000 | 0.000 | ||
| 1 spectrum, DSFFNPATR | 0.000 | 0.146 | 0.000 | 0.000 | 0.032 | 0.815 | 0.007 | 0.000 |
| Plot | Lyso | Other | |||||||||||
| Expt C |
10 peptides |
17 spectra |
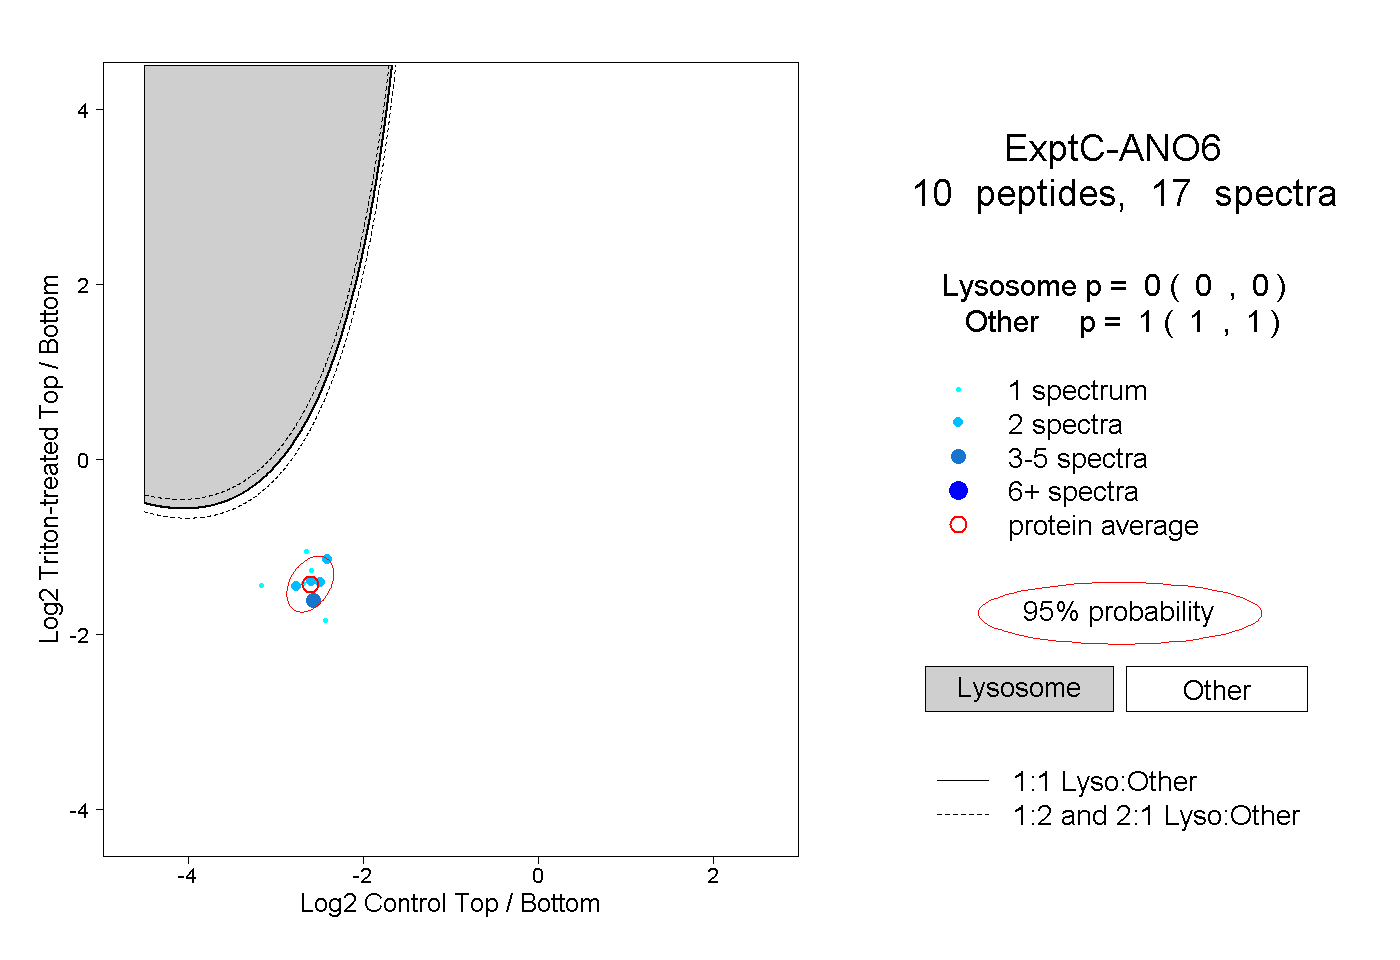 |
0.000 0.000 | 0.000 |
1.000 1.000 | 1.000 |
||||||||
| Plot | Lyso | Other | |||||||||||
| Expt D |
1 peptide |
2 spectra |
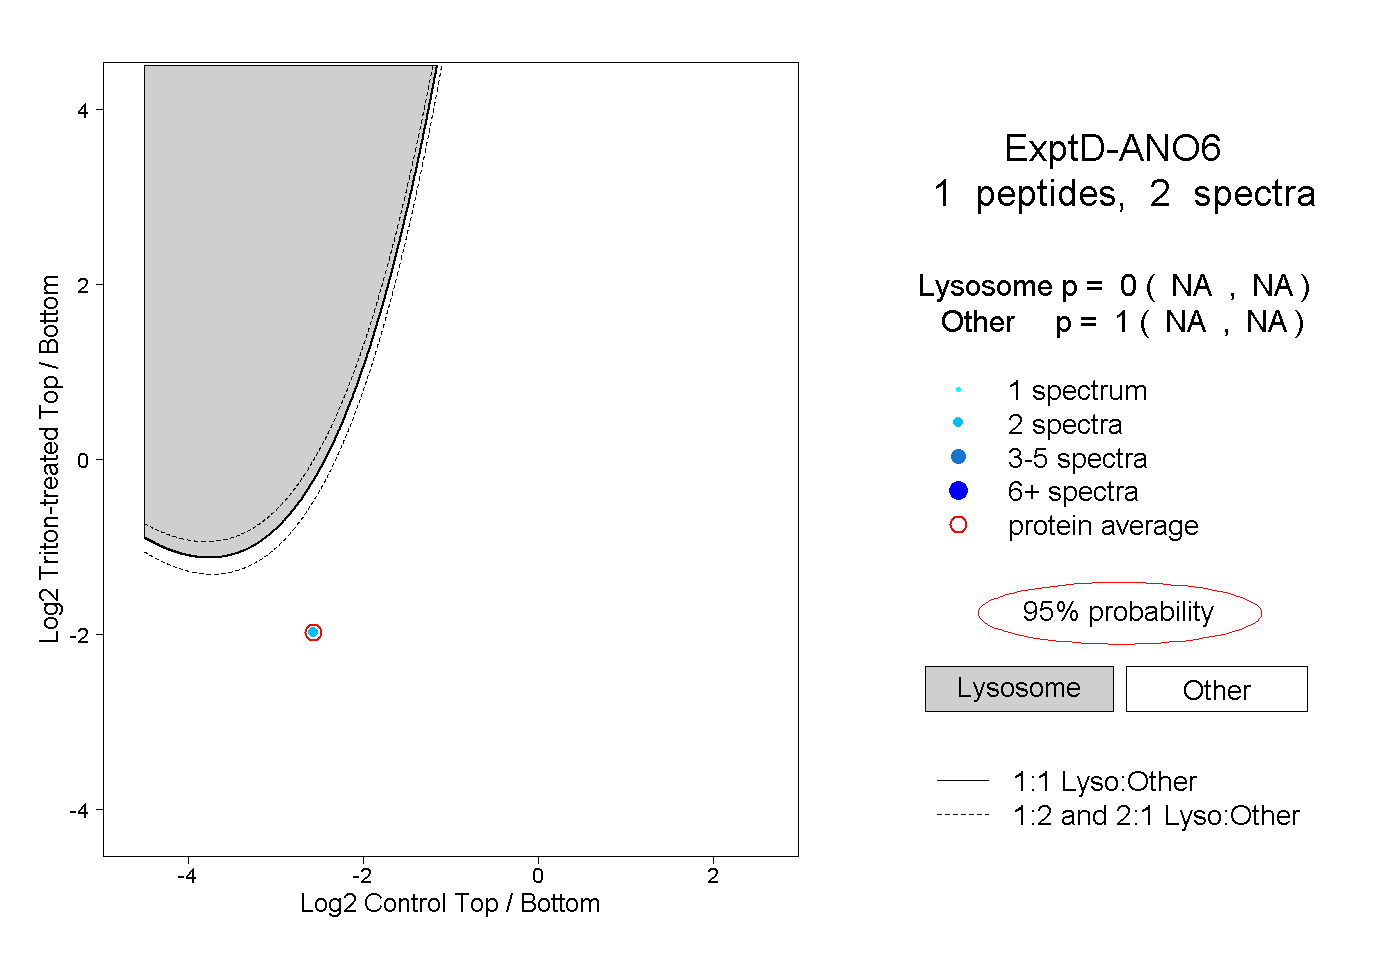 |
0.000 NA | NA |
1.000 NA | NA |