AMY2A3
[ENSRNOP00000058967]
Main page
| | | Plot |
Mito |
Lyso |
|
Perox |
ER |
Golgi |
PM |
Cytosol |
Nucleus |
|
| Expt A |
 8
8
peptides |
18
spectra |
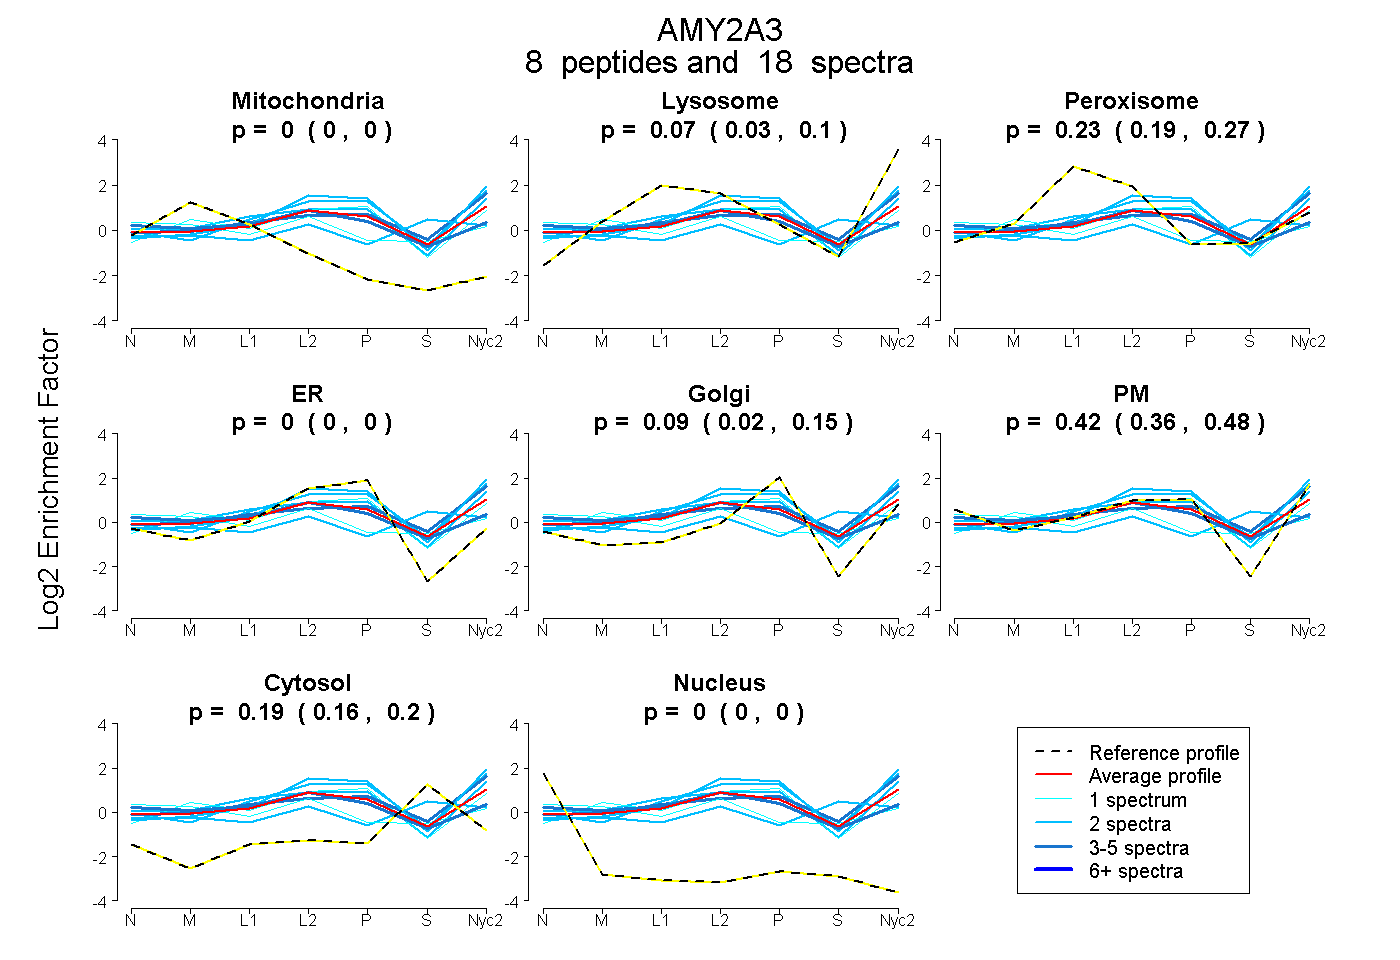 |
0.000
0.000 | 0.000 |
0.071
0.032 | 0.101 |
|
0.230
0.189 | 0.265 |
0.000
0.000 | 0.000 |
0.089
0.024 | 0.146 |
0.424
0.361 | 0.477 |
0.187
0.165 | 0.205 |
0.000
0.000 | 0.000 |
|
| | | Plot |
Mito |
|
Lyso or Perox |
|
ER |
Golgi |
PM |
Cytosol |
Nucleus |
|
| Expt B |
13
peptides |
59
spectra |
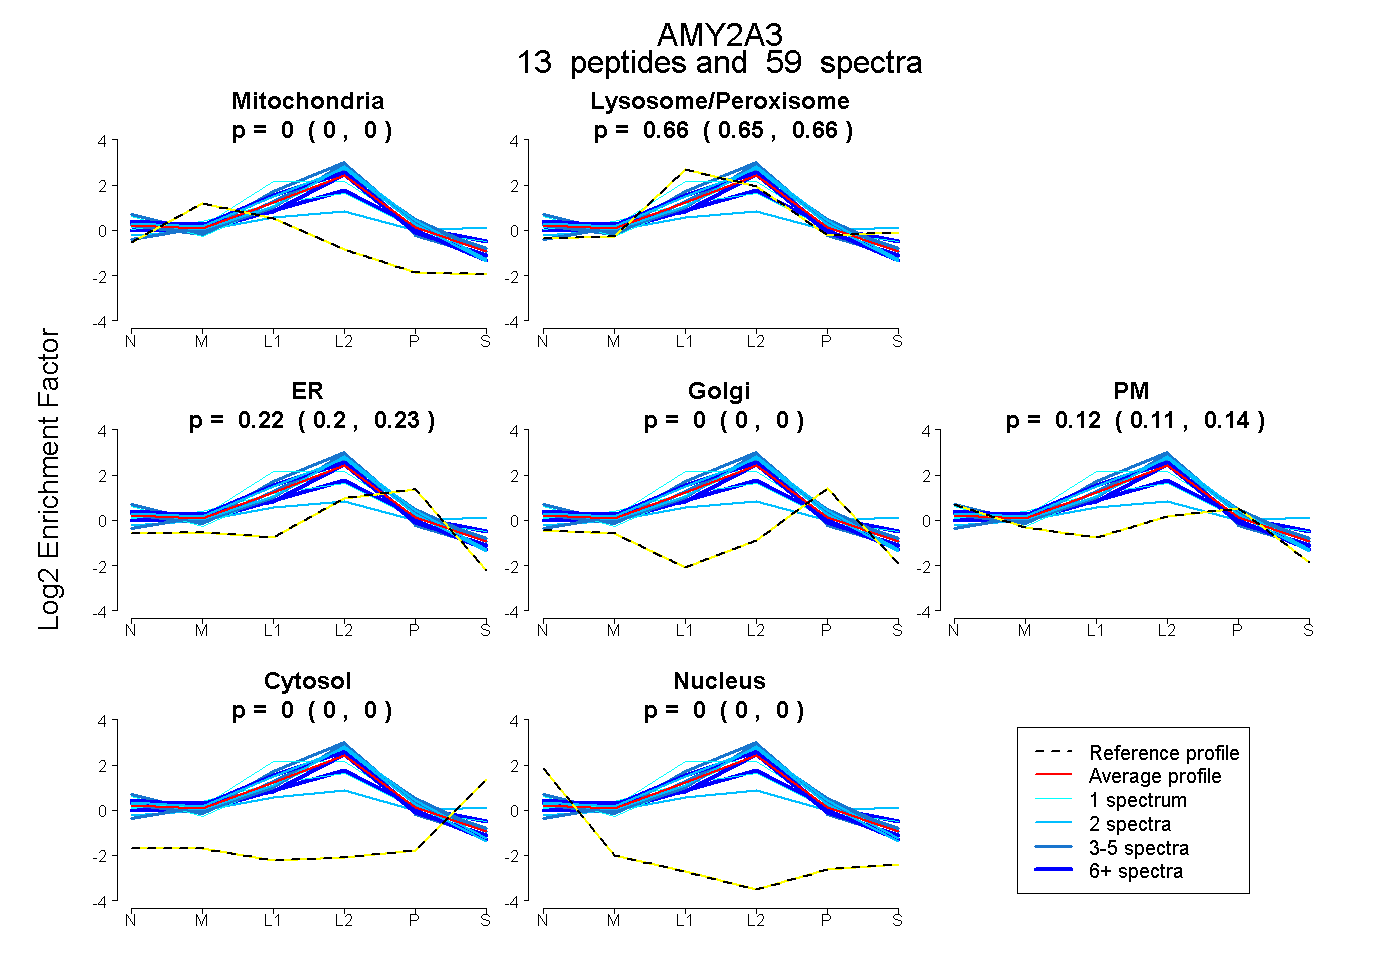 |
0.000
0.000 | 0.000 |
|
0.658
0.651 | 0.663 |
|
0.218
0.204 | 0.230 |
0.000
0.000 | 0.000 |
0.124
0.109 | 0.138 |
0.000
0.000 | 0.000 |
0.000
0.000 | 0.000 |
|
| | | Plot |
|
Lyso |
|
|
|
|
|
|
|
Other |
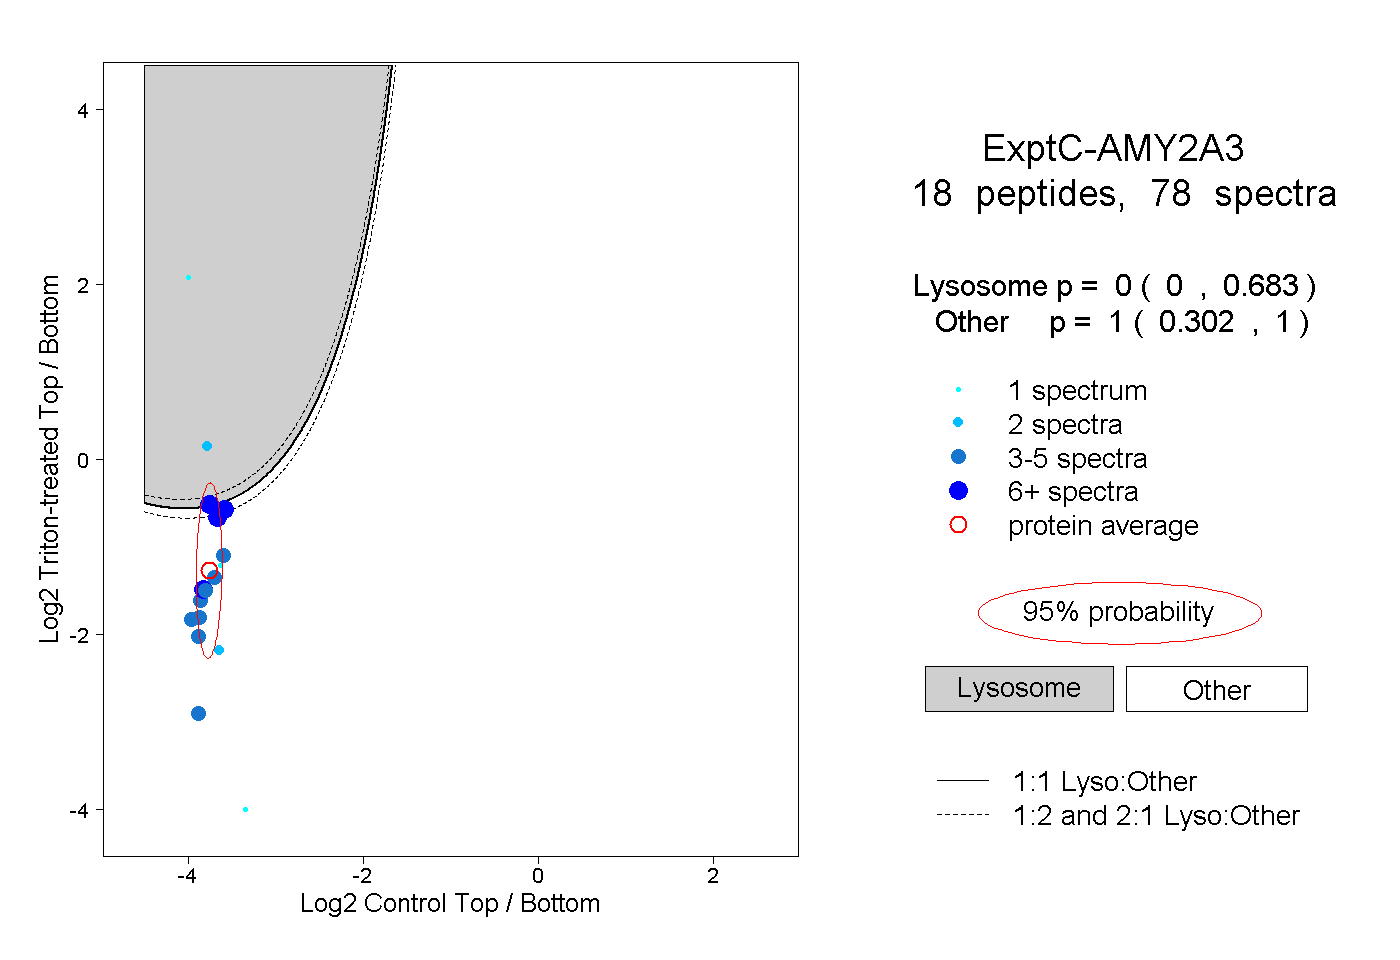
| Expt C |
18
peptides |
78
spectra |
 |
|
0.000
0.000 | 0.683 |
|
|
|
|
|
|
|
1.000
0.302 | 1.000 |
| | | Plot |
|
Lyso |
|
|
|
|
|
|
|
Other |
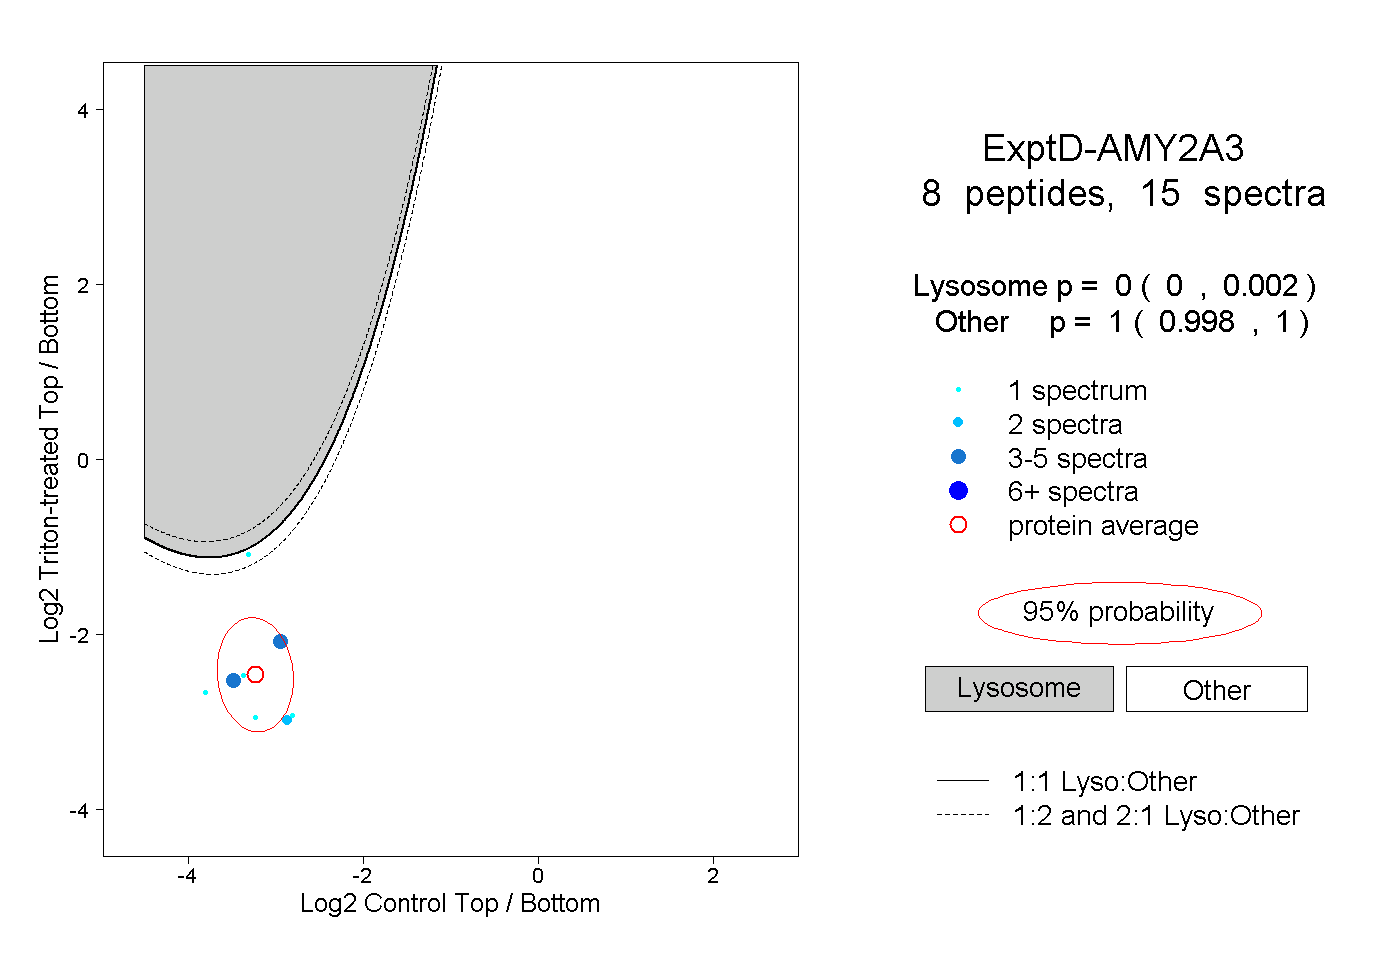
| Expt D |
8
peptides |
15
spectra |
 |
|
0.000
0.000 | 0.002 |
|
|
|
|
|
|
|
1.000
0.998 | 1.000 |
| 1 spectrum, SGNENEFK |
|
0.000 |
|
|
|
|
|
|
|
1.000 |
| 1 spectrum, HMWPGDIK |
|
0.000 |
|
|
|
|
|
|
|
1.000 |
| 1 spectrum, TAIVHLFEWR |
|
0.000 |
|
|
|
|
|
|
|
1.000 |
| 1 spectrum, LGTVIR |
|
0.000 |
|
|
|
|
|
|
|
1.000 |
| 3 spectra, NMVAFR |
|
0.000 |
|
|
|
|
|
|
|
1.000 |
| 5 spectra, YQPISYK |
|
0.000 |
|
|
|
|
|
|
|
1.000 |
| 2 spectra, ALVFVDNHDNQR |
|
0.000 |
|
|
|
|
|
|
|
1.000 |
| 1 spectrum, VNVGSDGK |
|
0.397 |
|
|
|
|
|
|
|
0.603 |