 8
8peptides
spectra
0.000 | 0.000
0.032 | 0.101
0.189 | 0.265
0.000 | 0.000
0.024 | 0.146
0.361 | 0.477
0.165 | 0.205
0.000 | 0.000
| Plot | Mito | Lyso | Perox | ER | Golgi | PM | Cytosol | Nucleus | |||||
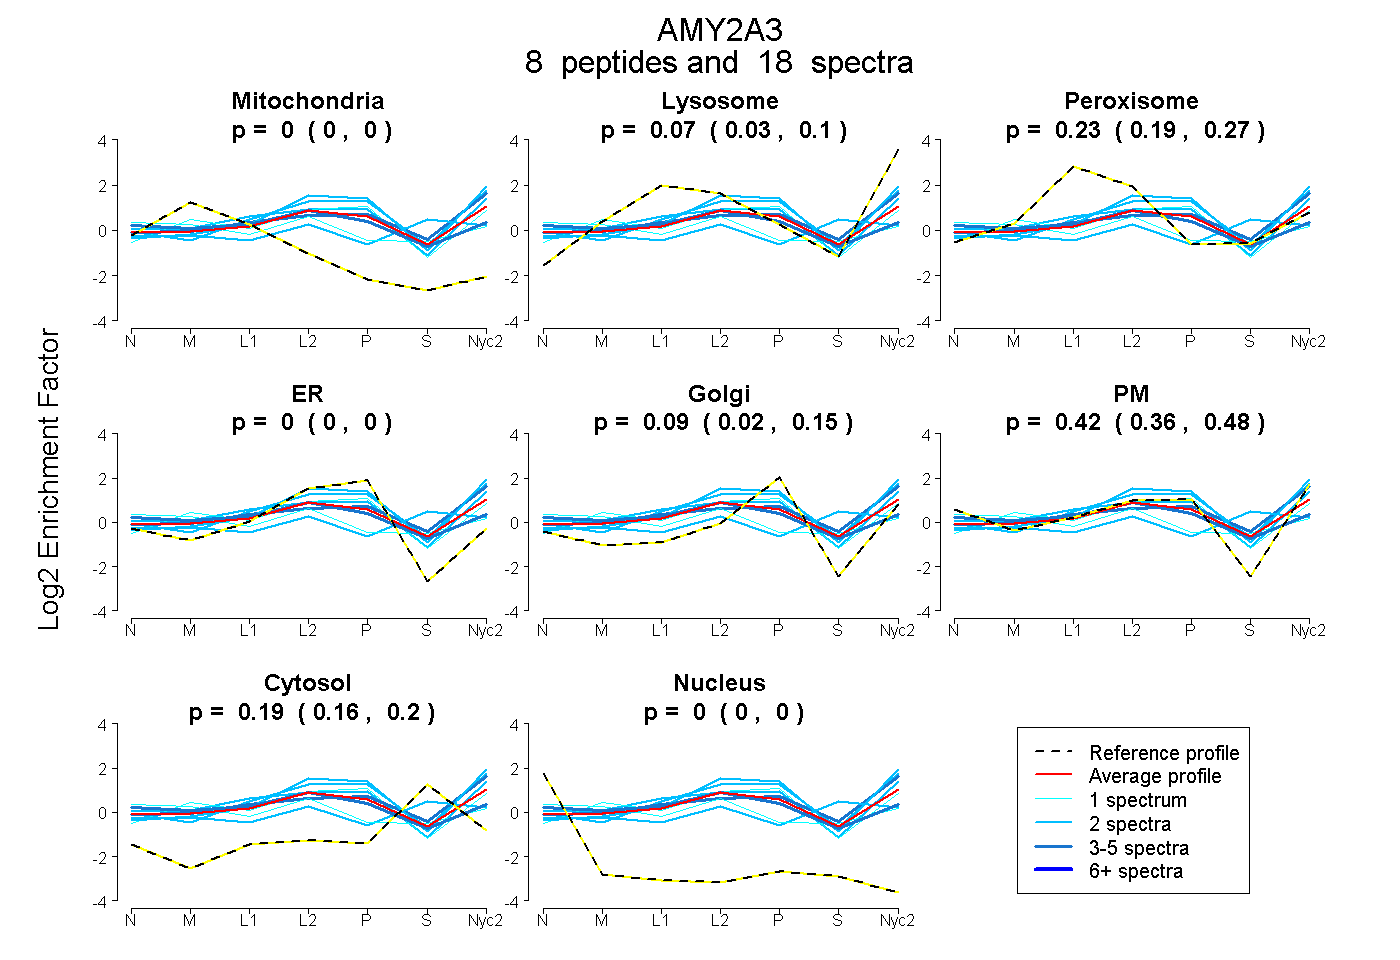
| Expt A |
8 peptides |
18 spectra |
|
0.000 0.000 | 0.000 |
0.071 0.032 | 0.101 |
0.230 0.189 | 0.265 |
0.000 0.000 | 0.000 |
0.089 0.024 | 0.146 |
0.424 0.361 | 0.477 |
0.187 0.165 | 0.205 |
0.000 0.000 | 0.000 |
| 1 spectrum, SGNENEFK | 0.179 | 0.000 | 0.209 | 0.000 | 0.000 | 0.372 | 0.240 | 0.000 | ||
| 2 spectra, NWGEGWGFVPTDR | 0.048 | 0.009 | 0.257 | 0.000 | 0.000 | 0.217 | 0.469 | 0.000 | ||
| 2 spectra, HMWPGDIK | 0.000 | 0.111 | 0.246 | 0.000 | 0.188 | 0.403 | 0.052 | 0.000 | ||
| 4 spectra, TAIVHLFEWR | 0.060 | 0.000 | 0.263 | 0.111 | 0.000 | 0.384 | 0.182 | 0.000 | ||
| 2 spectra, NMVAFR | 0.000 | 0.401 | 0.000 | 0.192 | 0.108 | 0.231 | 0.068 | 0.000 | ||
| 2 spectra, ALVFVDNHDNQR | 0.000 | 0.292 | 0.029 | 0.125 | 0.000 | 0.426 | 0.128 | 0.000 | ||
| 4 spectra, MAVGFMLAHPYGFTR | 0.000 | 0.251 | 0.079 | 0.000 | 0.000 | 0.458 | 0.211 | 0.000 | ||
| 1 spectrum, LHNLNTK | 0.078 | 0.191 | 0.189 | 0.117 | 0.402 | 0.000 | 0.022 | 0.000 |
| Plot | Mito | Lyso or Perox | ER | Golgi | PM | Cytosol | Nucleus | ||||||
| Expt B |
13 peptides |
59 spectra |
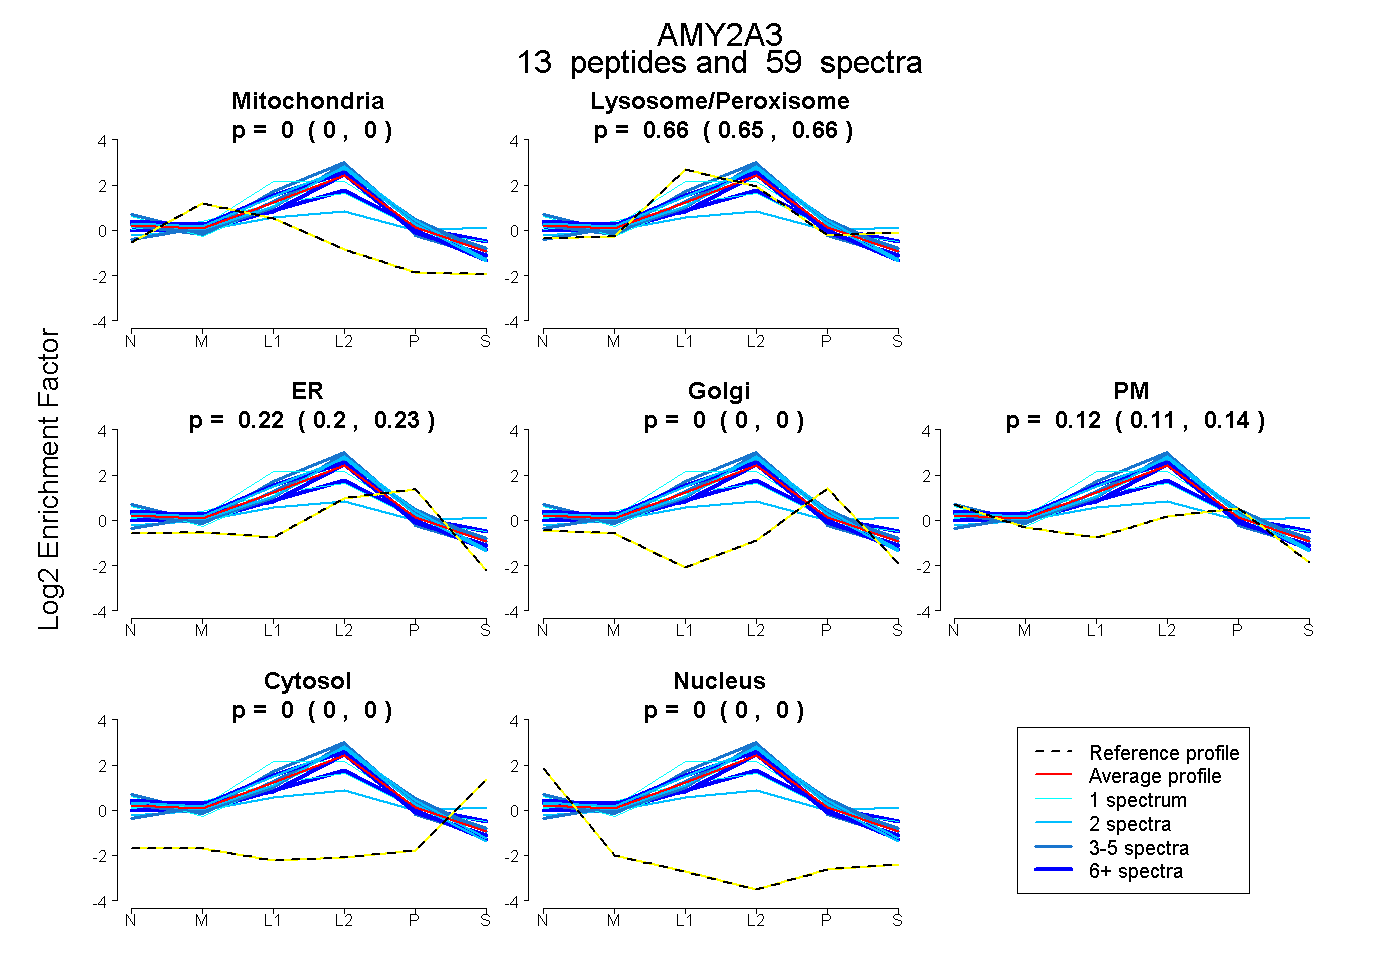 |
0.000 0.000 | 0.000 |
0.658 0.651 | 0.663 |
0.218 0.204 | 0.230 |
0.000 0.000 | 0.000 |
0.124 0.109 | 0.138 |
0.000 0.000 | 0.000 |
0.000 0.000 | 0.000 |
|||
| Plot | Lyso | Other | |||||||||||
| Expt C |
18 peptides |
78 spectra |
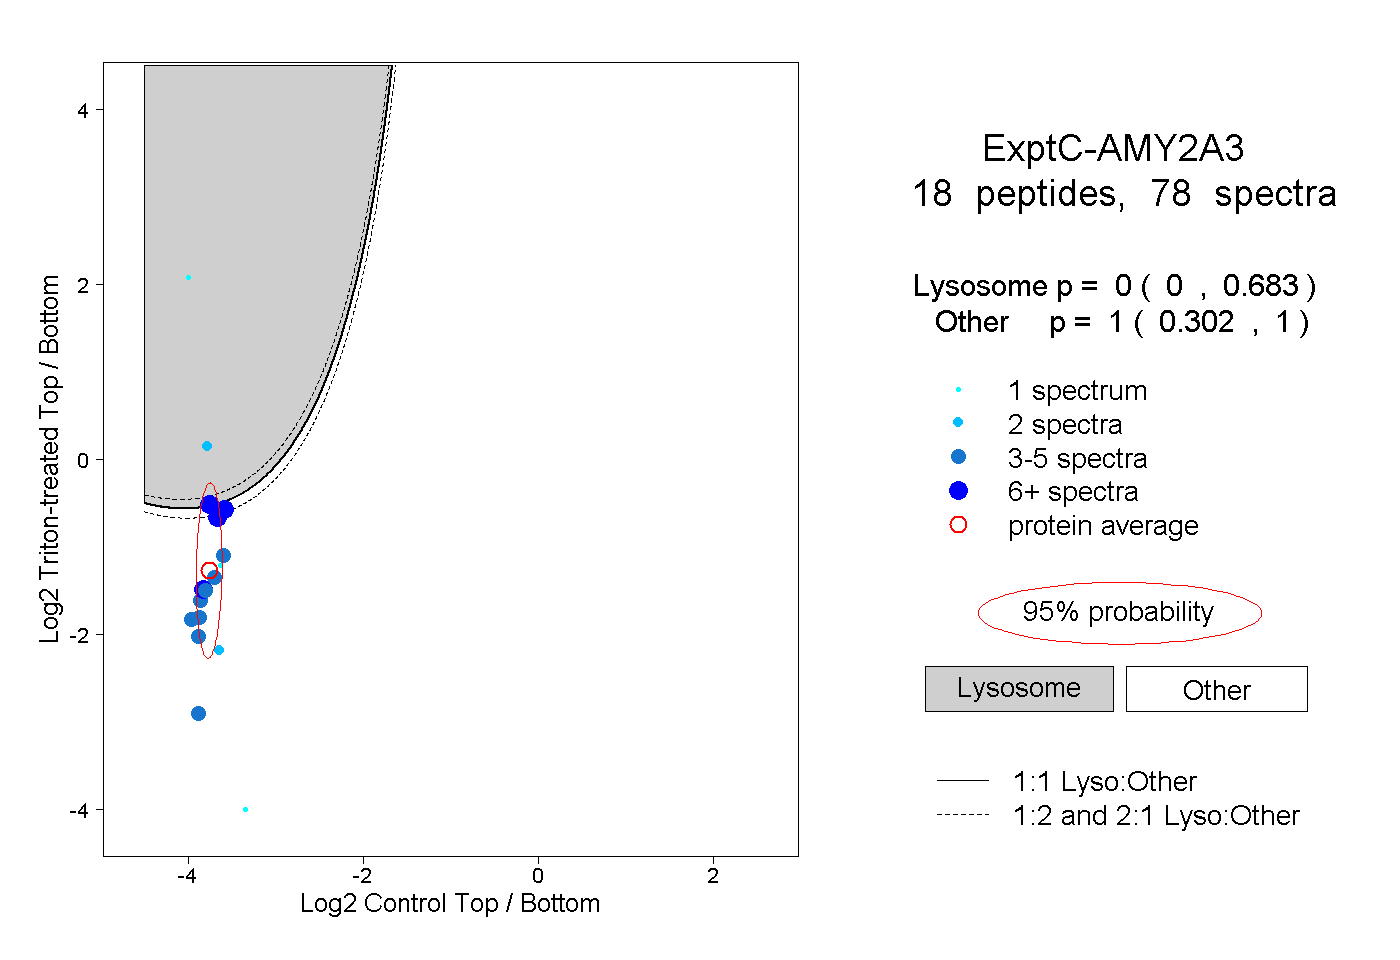 |
0.000 0.000 | 0.683 |
1.000 0.302 | 1.000 |
||||||||
| Plot | Lyso | Other | |||||||||||
| Expt D |
8 peptides |
15 spectra |
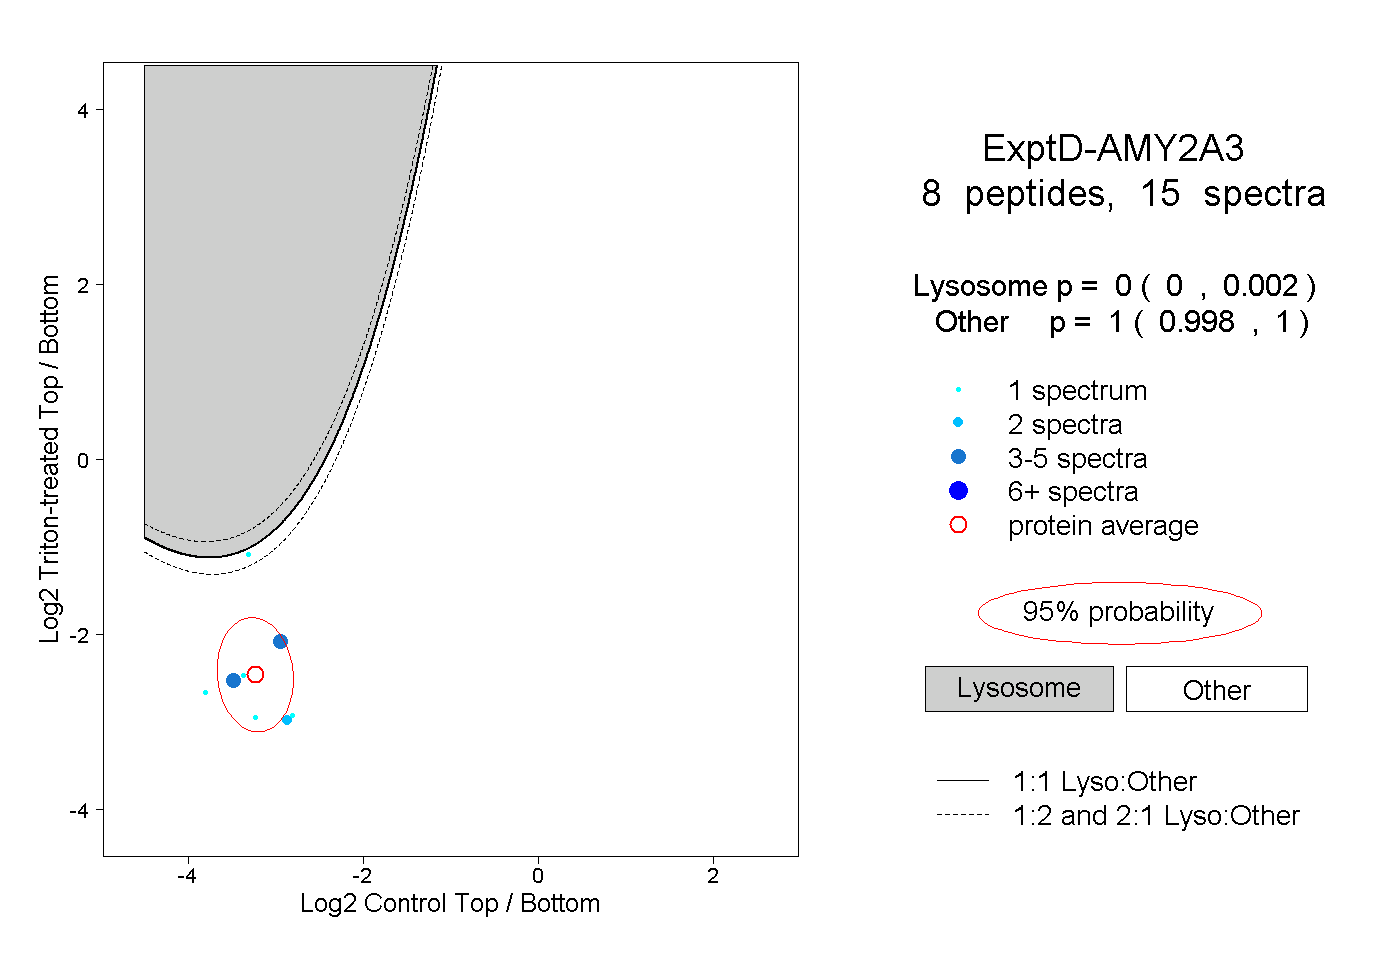 |
0.000 0.000 | 0.002 |
1.000 0.998 | 1.000 |