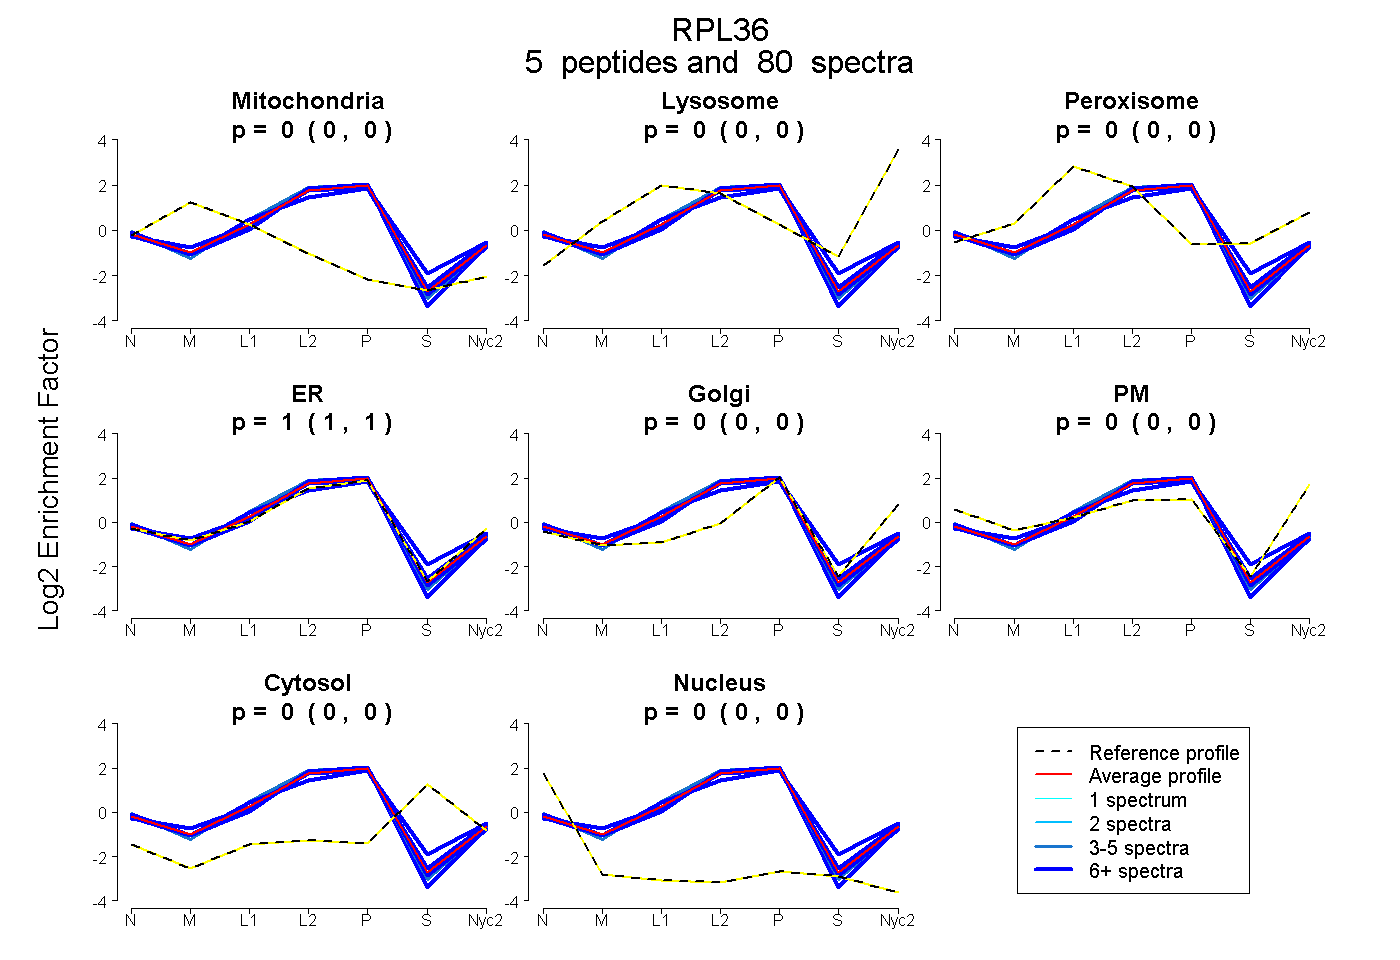
 5
5peptides
spectra
0.000 | 0.000
0.000 | 0.000
0.000 | 0.000
0.999 | 1.000
0.000 | 0.000
0.000 | 0.000
0.000 | 0.000
0.000 | 0.001
| Plot | Mito | Lyso | Perox | ER | Golgi | PM | Cytosol | Nucleus | |||||
| Expt A |
5 peptides |
80 spectra |
|
0.000 0.000 | 0.000 |
0.000 0.000 | 0.000 |
0.000 0.000 | 0.000 |
1.000 0.999 | 1.000 |
0.000 0.000 | 0.000 |
0.000 0.000 | 0.000 |
0.000 0.000 | 0.000 |
0.000 0.000 | 0.001 |
| 27 spectra, VGTHIR | 0.000 | 0.000 | 0.058 | 0.893 | 0.000 | 0.000 | 0.049 | 0.000 | ||
| 6 spectra, YPMAVGLNK | 0.000 | 0.000 | 0.045 | 0.935 | 0.000 | 0.000 | 0.000 | 0.020 | ||
| 4 spectra, EVCGFAPYER | 0.000 | 0.000 | 0.000 | 1.000 | 0.000 | 0.000 | 0.000 | 0.000 | ||
| 13 spectra, EELSNVLAAMR | 0.000 | 0.000 | 0.000 | 1.000 | 0.000 | 0.000 | 0.000 | 0.000 | ||
| 30 spectra, NVSKPR | 0.000 | 0.000 | 0.000 | 0.994 | 0.000 | 0.000 | 0.000 | 0.006 |
| Plot | Mito | Lyso or Perox | ER | Golgi | PM | Cytosol | Nucleus | ||||||
| Expt B |
6 peptides |
26 spectra |
 |
0.000 0.000 | 0.000 |
0.076 0.058 | 0.092 |
0.924 0.906 | 0.939 |
0.000 0.000 | 0.000 |
0.000 0.000 | 0.000 |
0.000 0.000 | 0.000 |
0.000 0.000 | 0.000 |
|||
| Plot | Lyso | Other | |||||||||||
| Expt D |
2 peptides |
11 spectra |
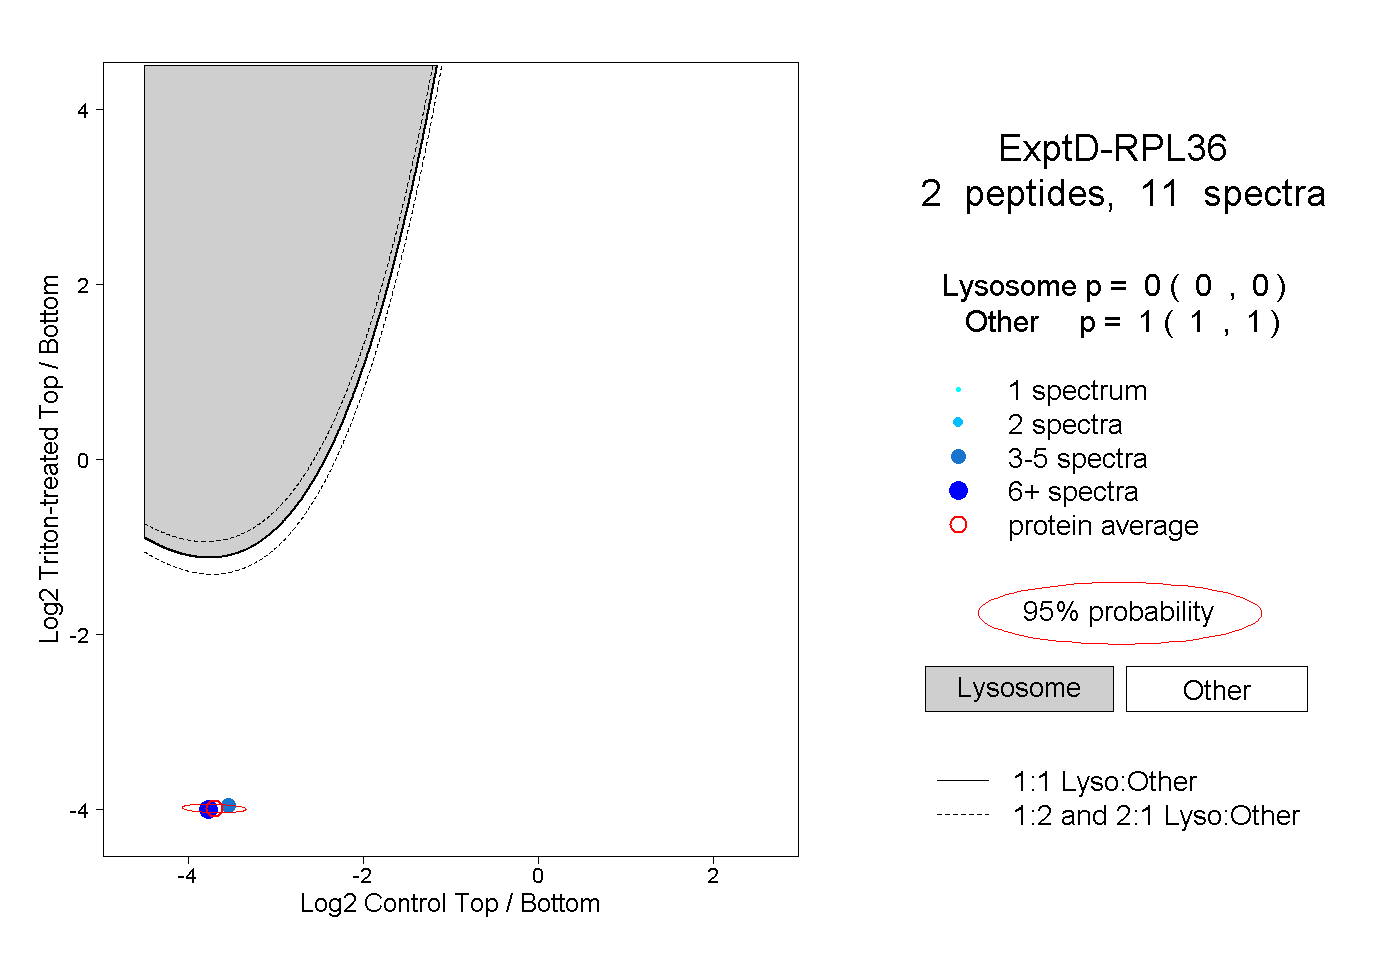 |
0.000 0.000 | 0.000 |
1.000 1.000 | 1.000 |