 6
6peptides
spectra
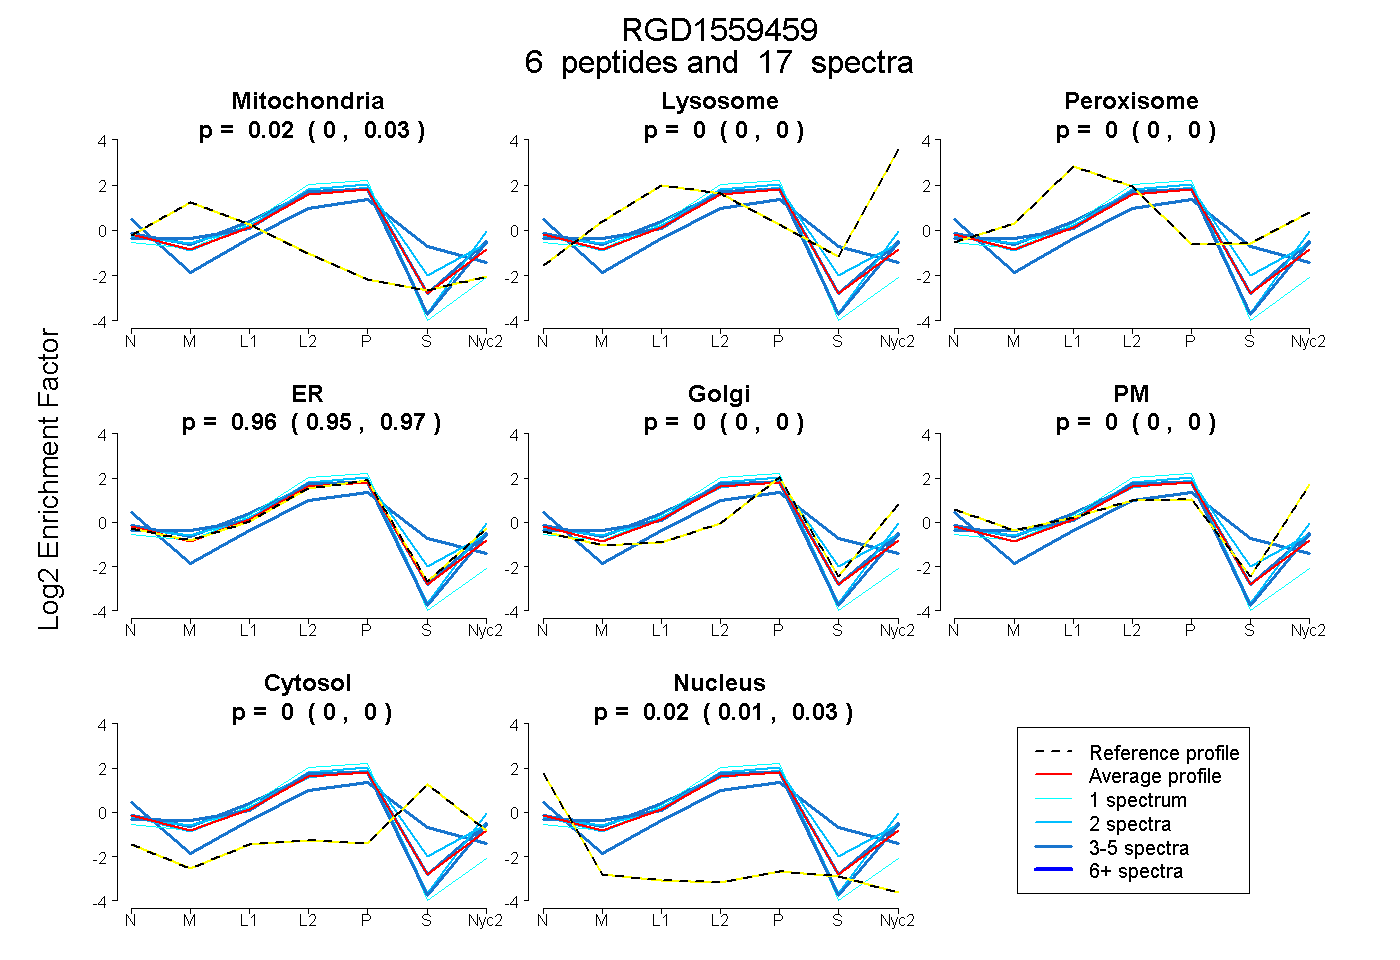
0.000 | 0.035
0.000 | 0.000
0.000 | 0.000
0.946 | 0.971
0.000 | 0.000
0.000 | 0.000
0.000 | 0.000
0.008 | 0.035
1peptide
spectrum
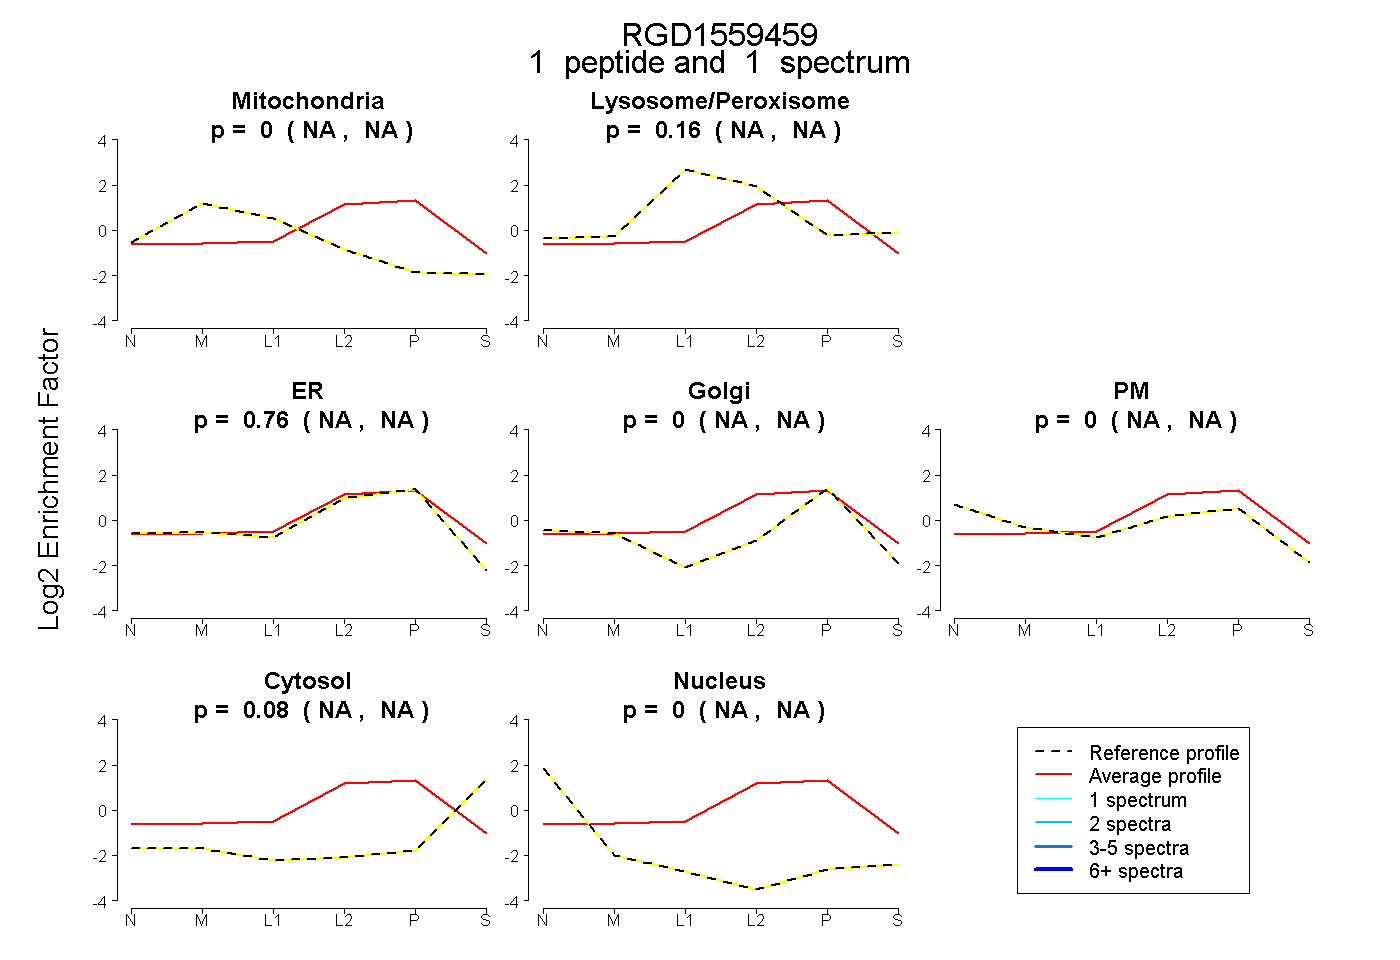
NA | NA
NA | NA
NA | NA
NA | NA
NA | NA
NA | NA
NA | NA
5peptides
spectra
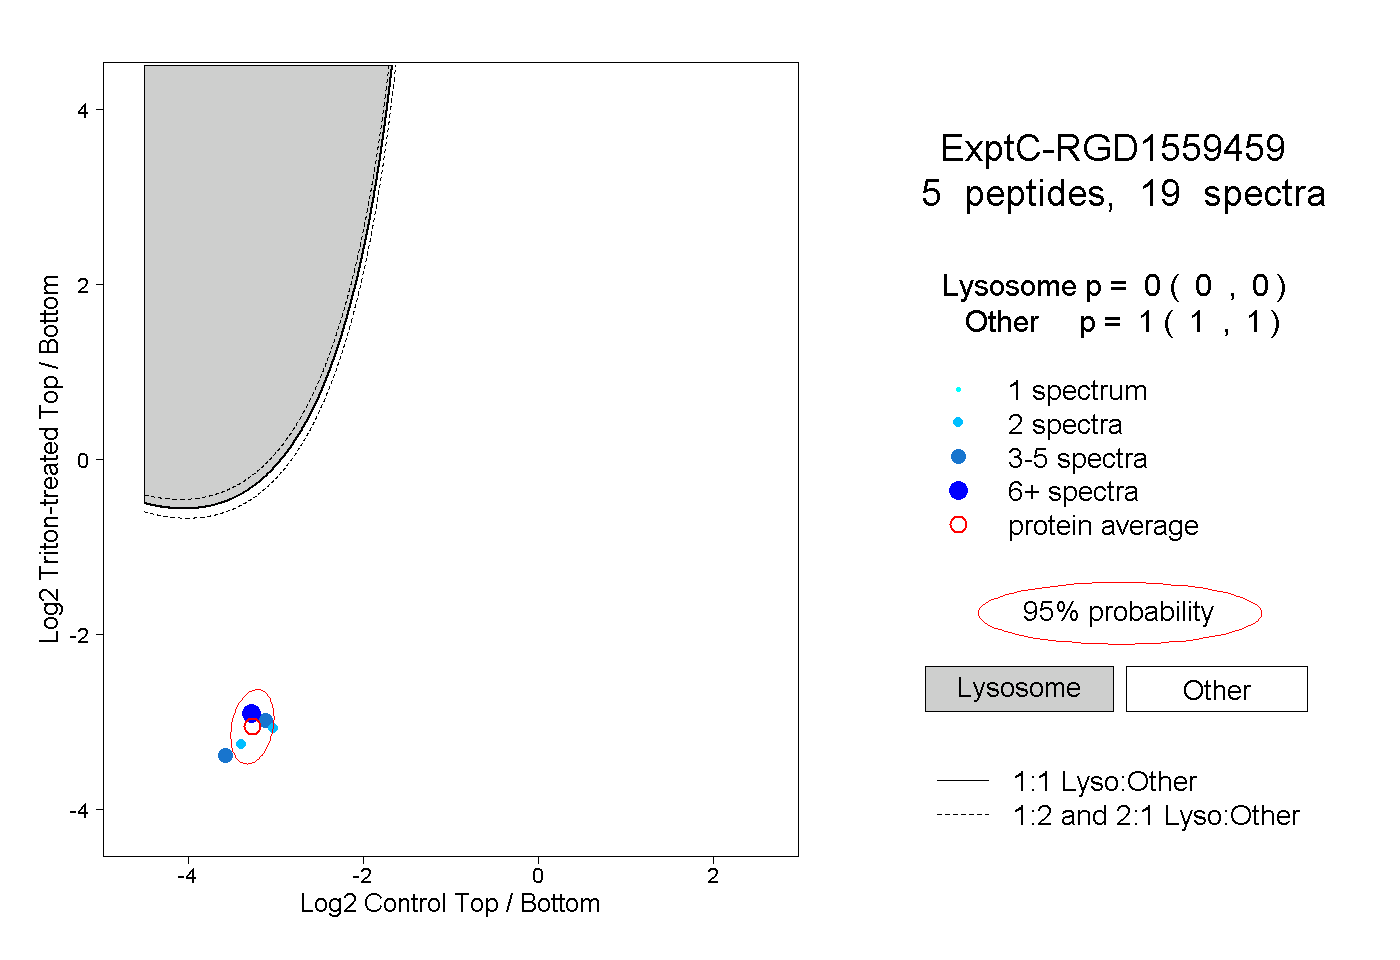
0.000 | 0.000
1.000 | 1.000
3peptides
spectra
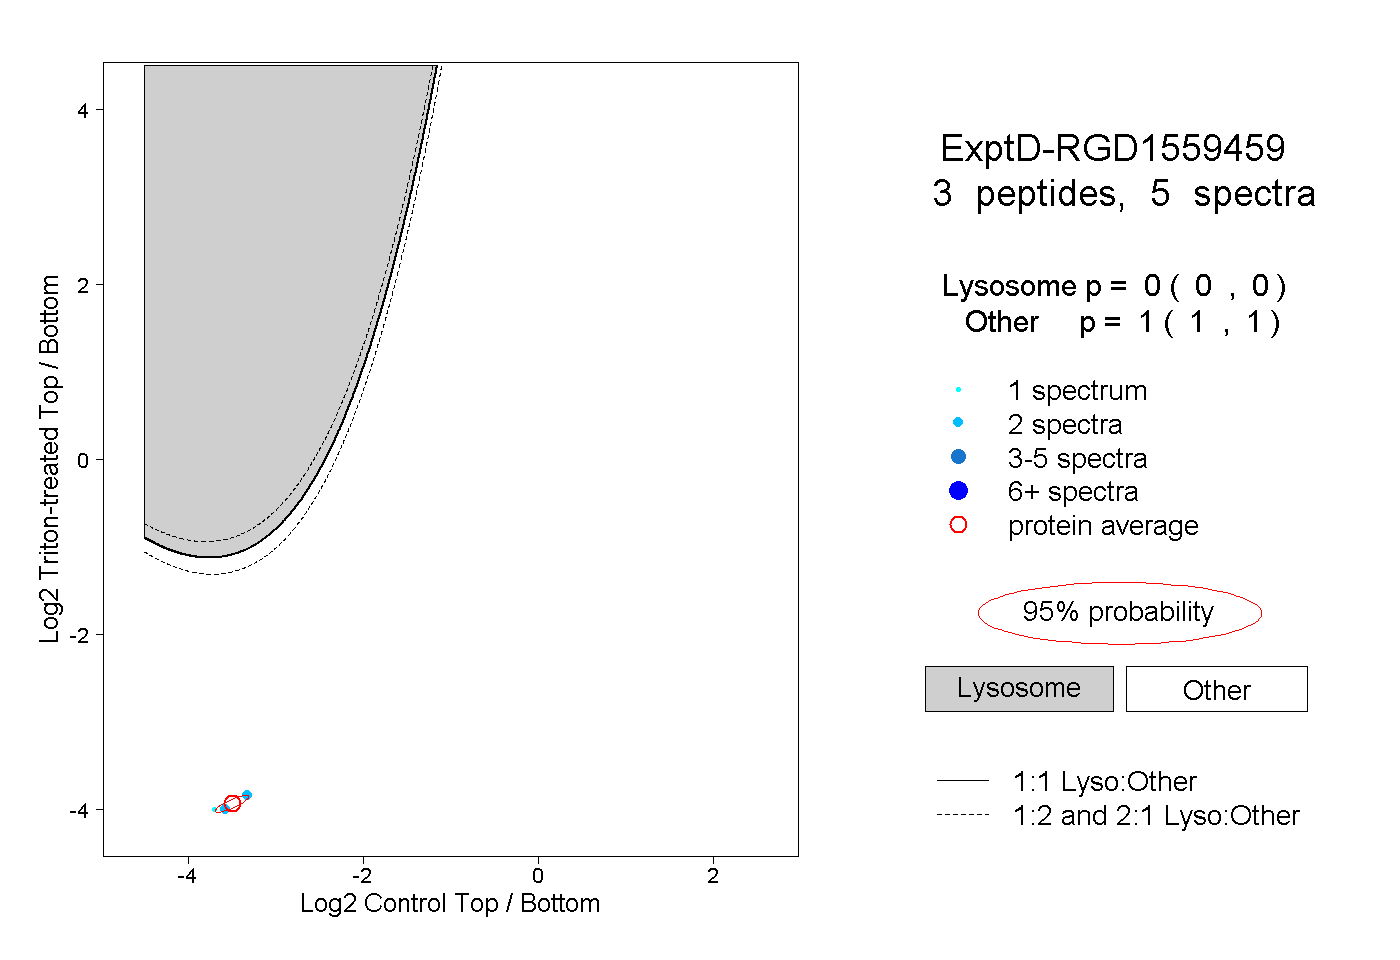
0.000 | 0.000
1.000 | 1.000