 2
2peptides
spectra
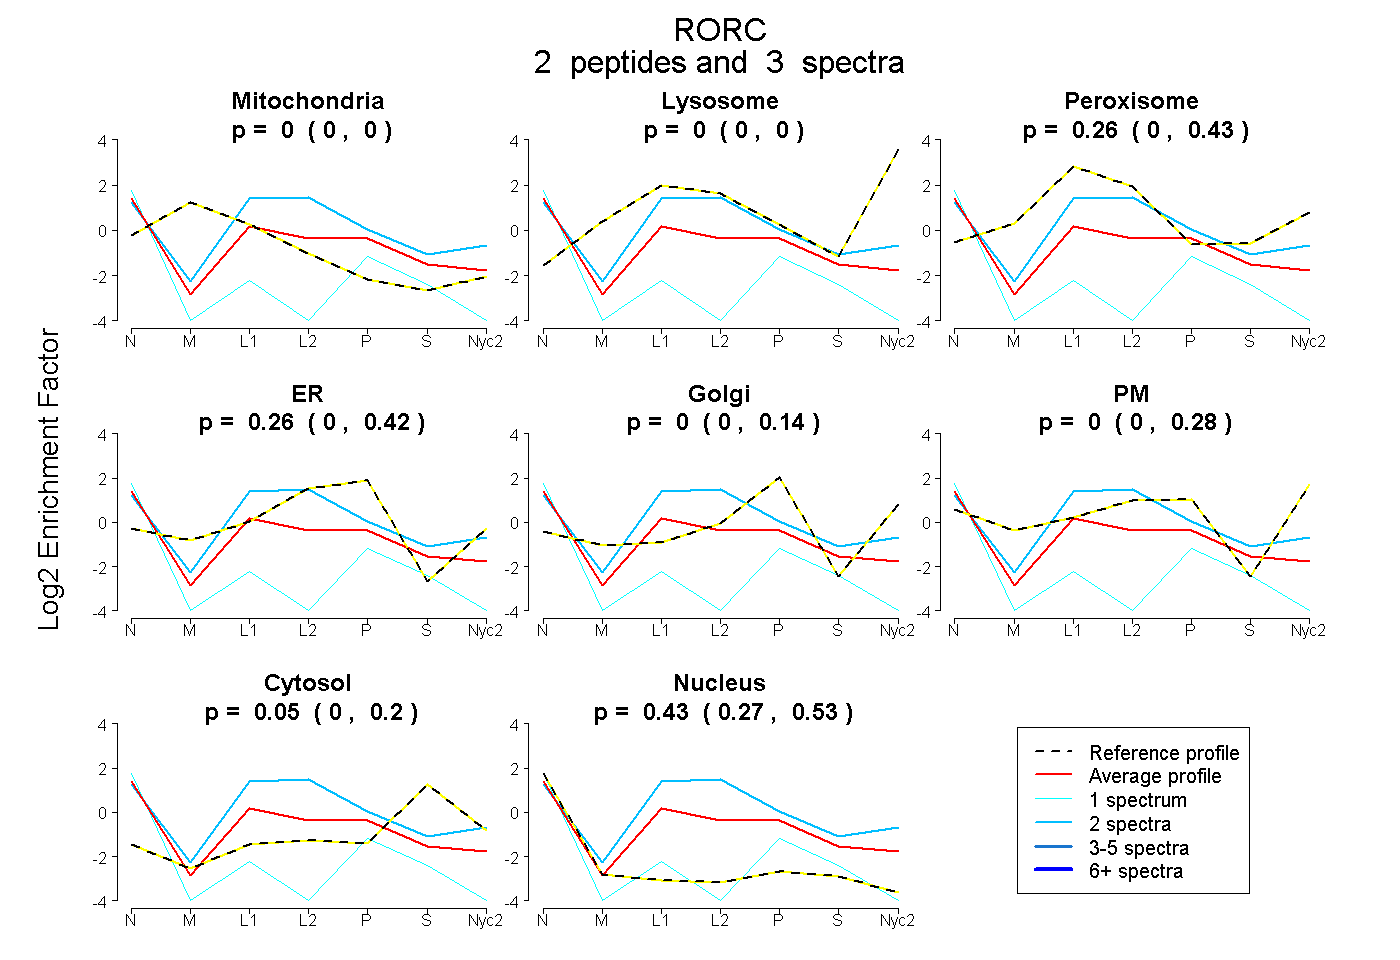
0.000 | 0.000
0.000 | 0.000
0.000 | 0.435
0.000 | 0.421
0.000 | 0.137
0.000 | 0.283
0.000 | 0.203
0.268 | 0.534
1peptide
spectrum
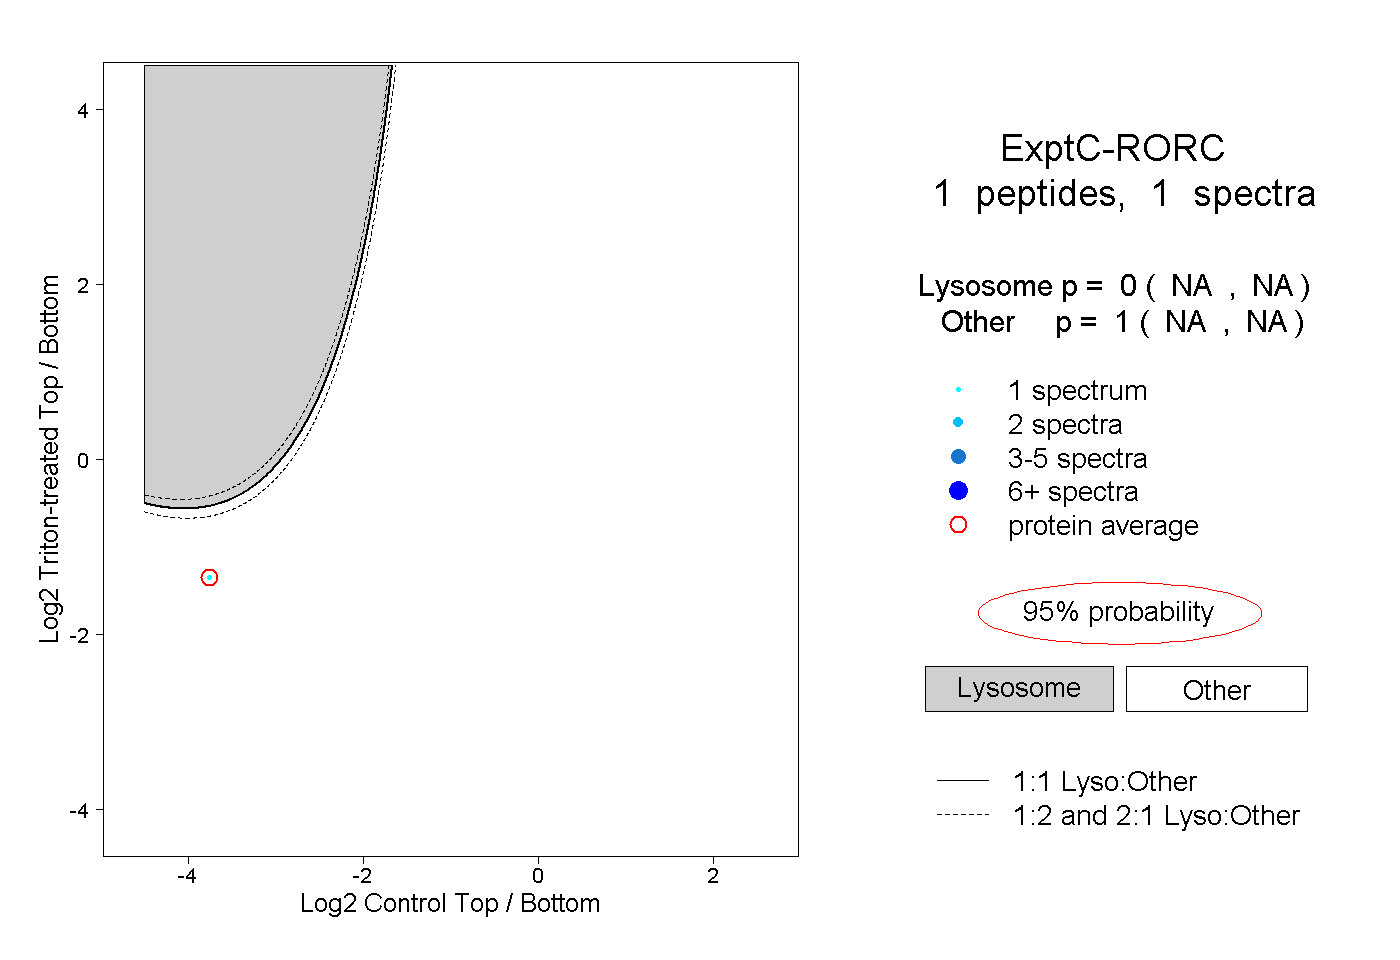
NA | NA
NA | NA
| Plot | Mito | Lyso | Perox | ER | Golgi | PM | Cytosol | Nucleus | |||||
| Expt A |
2 peptides |
3 spectra |
|
0.000 0.000 | 0.000 |
0.000 0.000 | 0.000 |
0.260 0.000 | 0.435 |
0.261 0.000 | 0.421 |
0.000 0.000 | 0.137 |
0.000 0.000 | 0.283 |
0.054 0.000 | 0.203 |
0.425 0.268 | 0.534 |
||
| Plot | Lyso | Other | |||||||||||
| Expt C |
1 peptide |
1 spectrum |
|
0.000 NA | NA |
1.000 NA | NA |