 2
2peptides
spectra
0.000 | 0.143
0.000 | 0.000
0.000 | 0.123
0.000 | 0.428
0.000 | 0.372
0.000 | 0.279
0.296 | 0.425
0.027 | 0.270
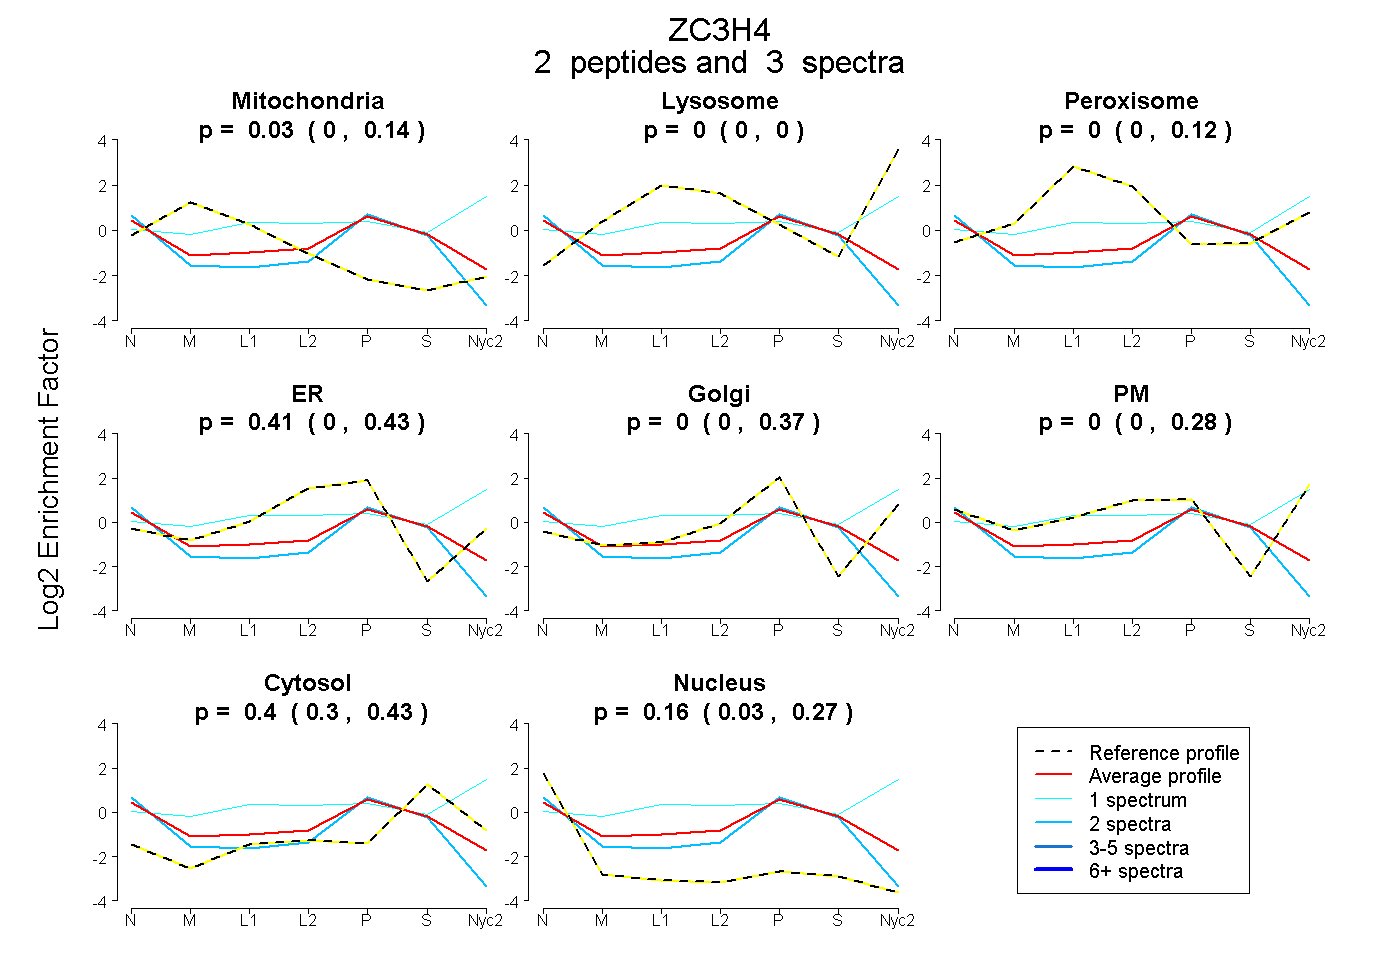
| Plot | Mito | Lyso | Perox | ER | Golgi | PM | Cytosol | Nucleus | |||||
| Expt A |
2 peptides |
3 spectra |
|
0.030 0.000 | 0.143 |
0.000 0.000 | 0.000 |
0.000 0.000 | 0.123 |
0.406 0.000 | 0.428 |
0.000 0.000 | 0.372 |
0.000 0.000 | 0.279 |
0.402 0.296 | 0.425 |
0.161 0.027 | 0.270 |
| 1 spectrum, EPPFVR | 0.000 | 0.211 | 0.107 | 0.000 | 0.000 | 0.402 | 0.280 | 0.000 | ||
| 2 spectra, FYITGFCAR | 0.000 | 0.000 | 0.000 | 0.308 | 0.000 | 0.000 | 0.331 | 0.361 |