 6
6peptides
spectra
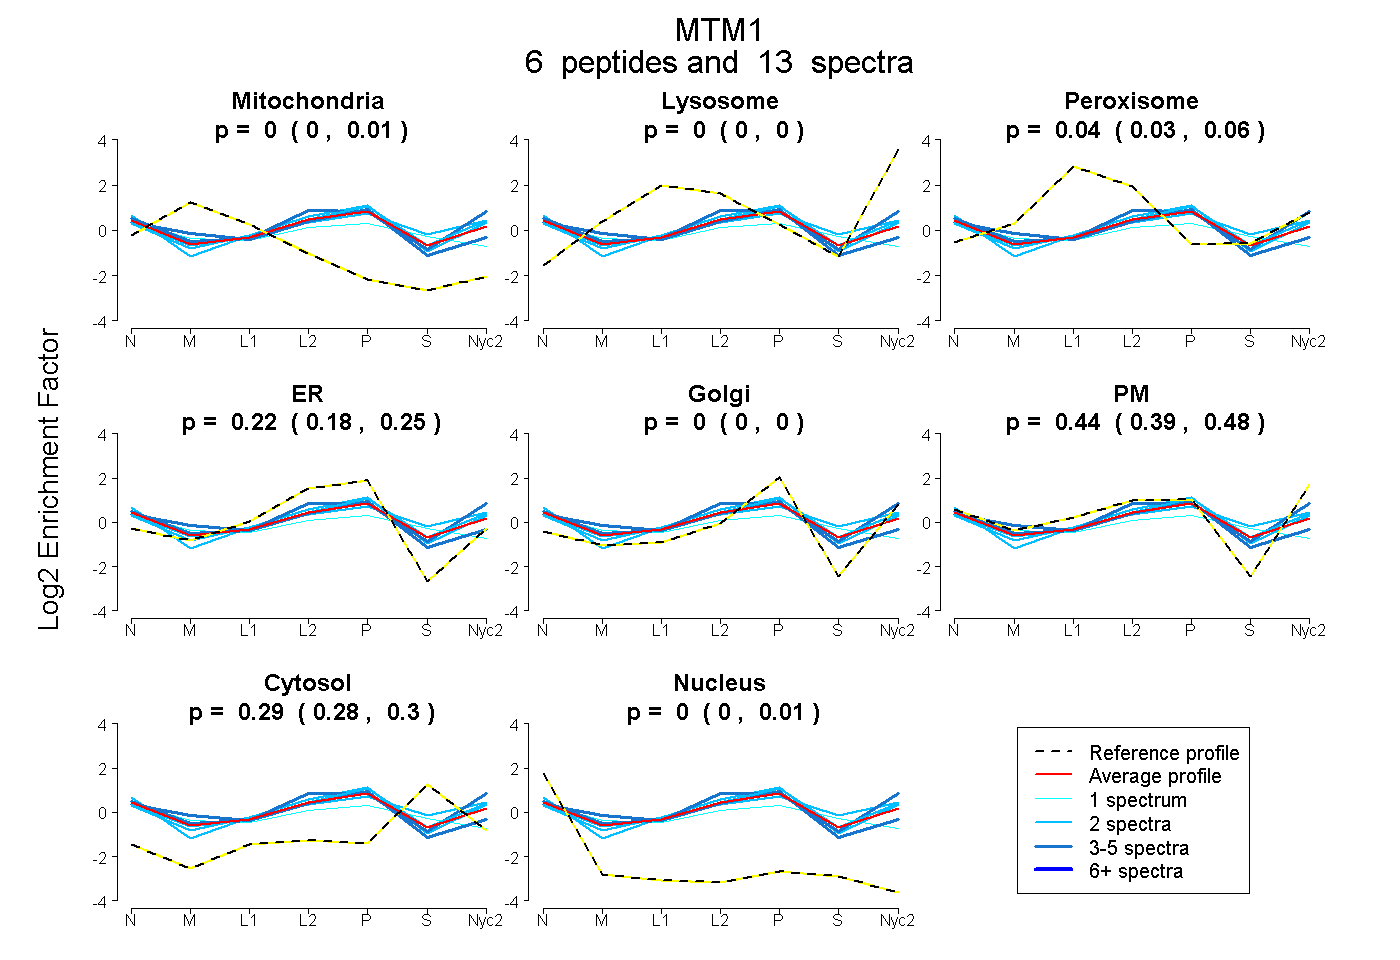
0.000 | 0.008
0.000 | 0.000
0.032 | 0.058
0.182 | 0.254
0.000 | 0.000
0.388 | 0.477
0.278 | 0.303
0.000 | 0.012
2peptides
spectra
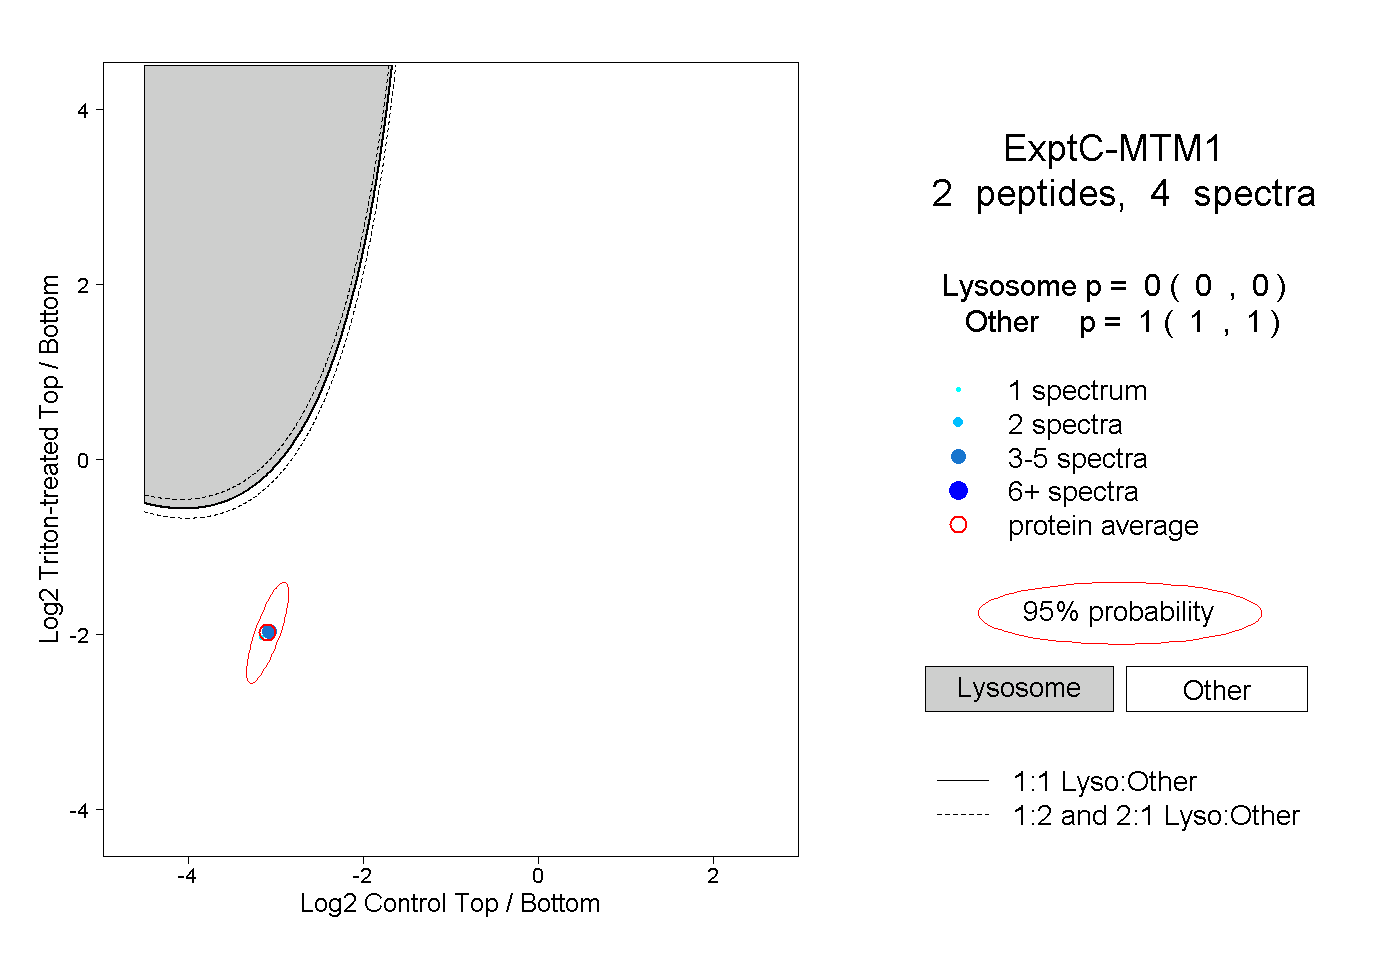
0.000 | 0.000
1.000 | 1.000
1peptide
spectra
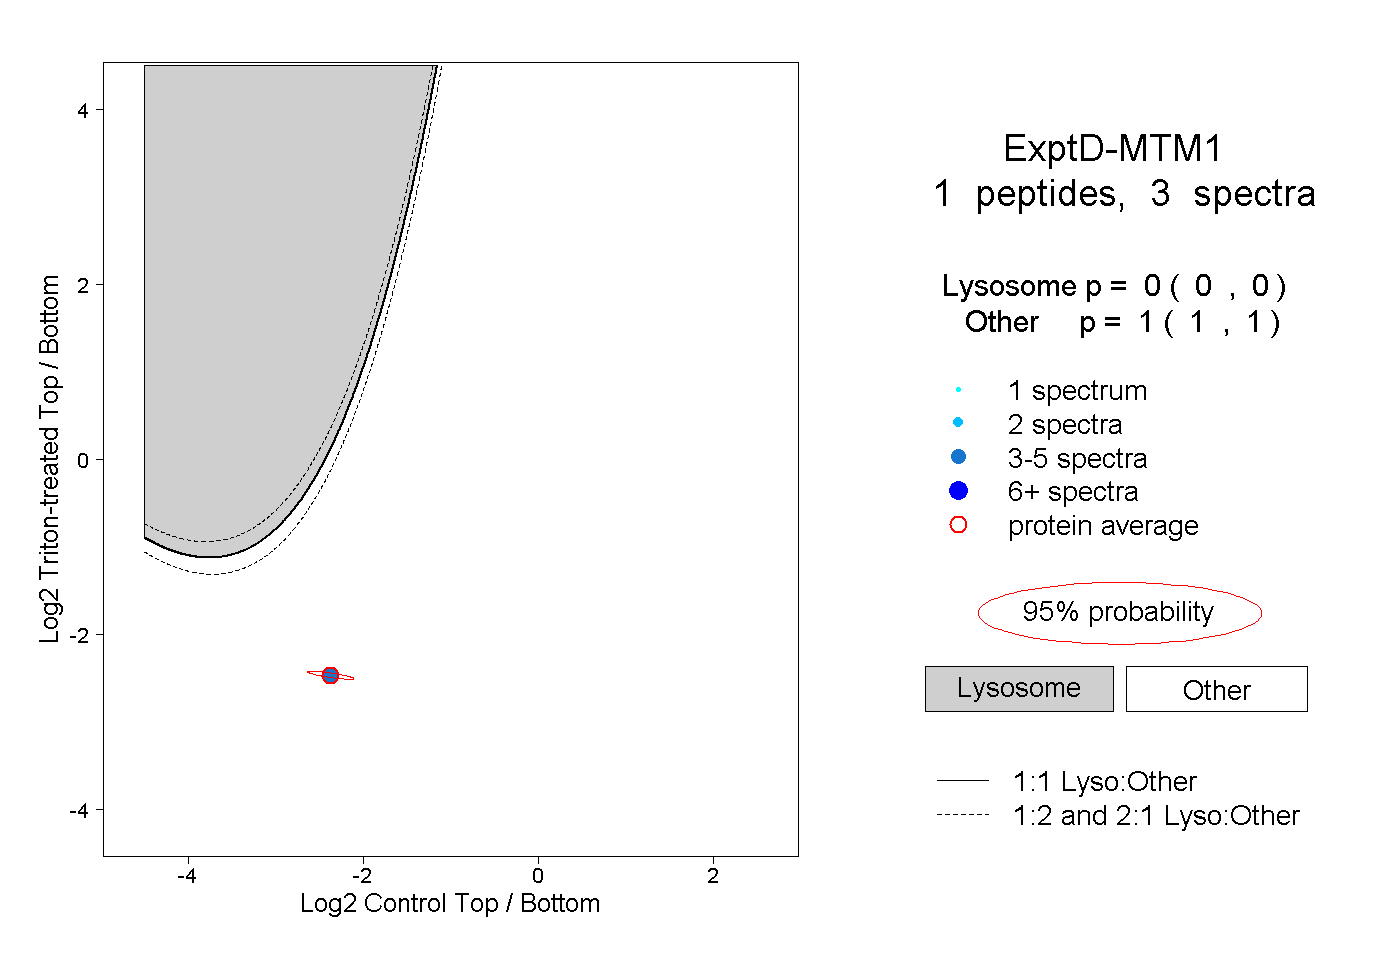
0.000 | 0.000
1.000 | 1.000