 2
2peptides
spectra
0.000 | 0.028
0.000 | 0.000
0.000 | 0.048
0.241 | 0.629
0.000 | 0.267
0.000 | 0.048
0.340 | 0.406
0.000 | 0.040
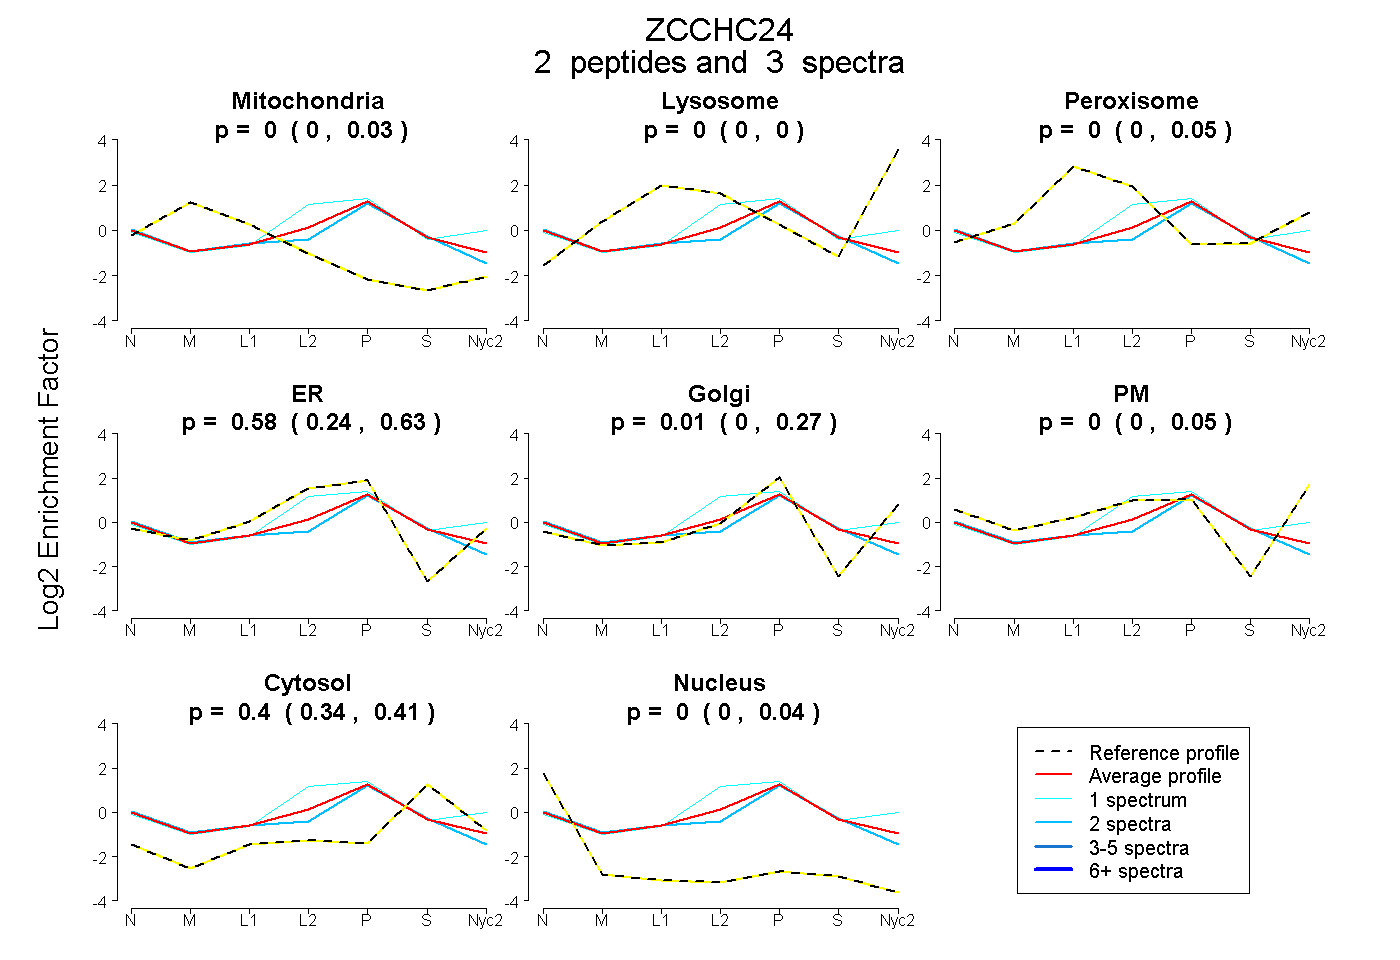
| Plot | Mito | Lyso | Perox | ER | Golgi | PM | Cytosol | Nucleus | |||||
| Expt A |
2 peptides |
3 spectra |
|
0.000 0.000 | 0.028 |
0.000 0.000 | 0.000 |
0.000 0.000 | 0.048 |
0.584 0.241 | 0.629 |
0.014 0.000 | 0.267 |
0.000 0.000 | 0.048 |
0.400 0.340 | 0.406 |
0.002 0.000 | 0.040 |
| 1 spectrum, RPPPNYLCHLCFNK | 0.000 | 0.022 | 0.011 | 0.542 | 0.000 | 0.129 | 0.296 | 0.000 | ||
| 2 spectra, EHPQHLCEK | 0.028 | 0.000 | 0.000 | 0.520 | 0.005 | 0.000 | 0.393 | 0.055 |