 25
25peptides
spectra
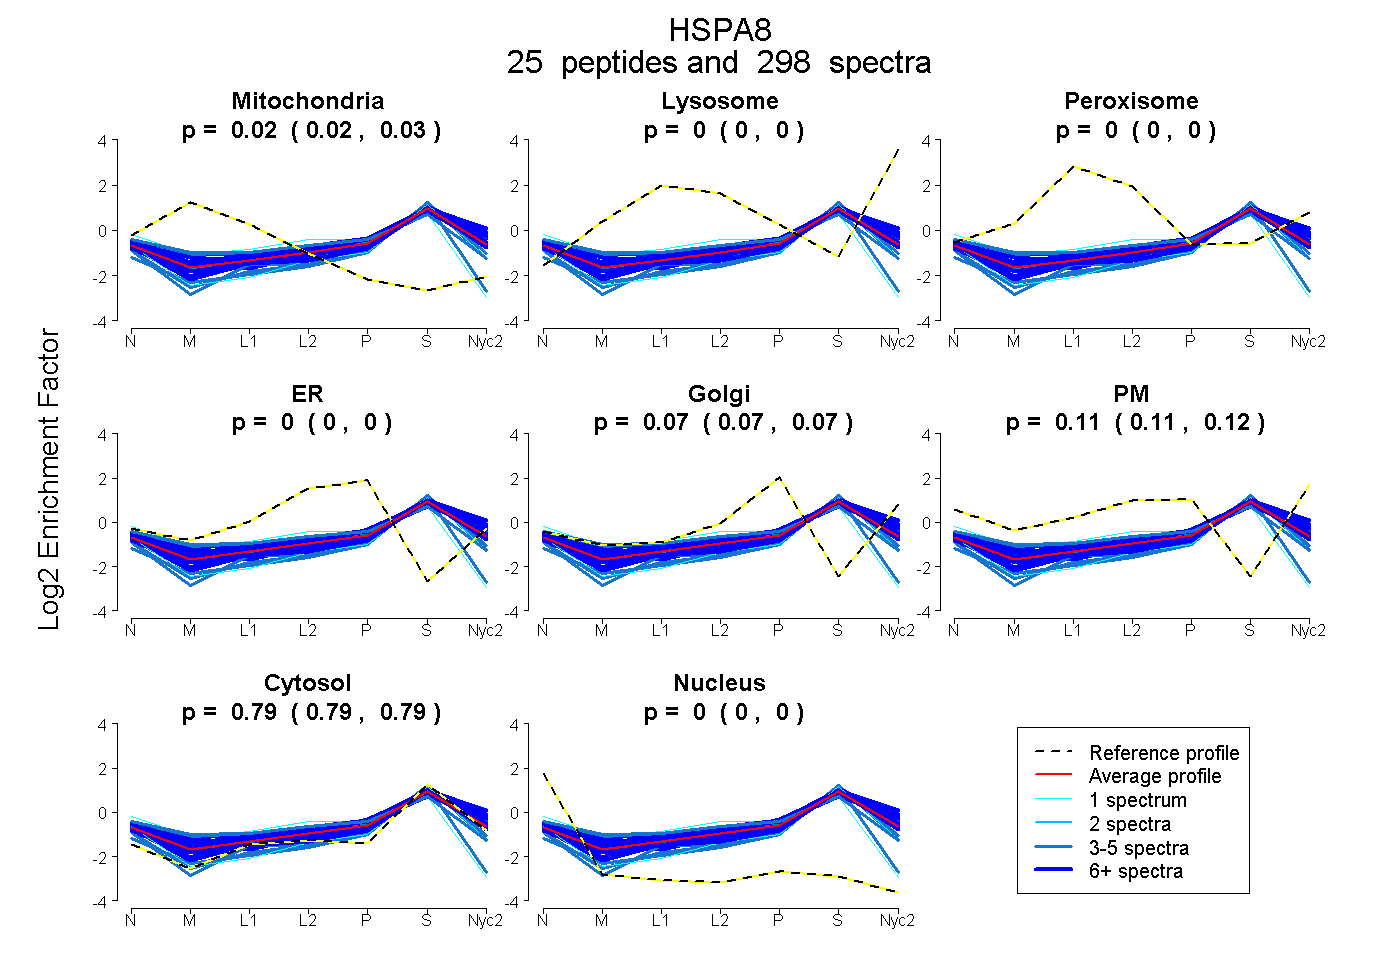
0.022 | 0.025
0.000 | 0.000
0.000 | 0.000
0.000 | 0.000
0.067 | 0.072
0.109 | 0.116
0.792 | 0.794
0.000 | 0.000
1peptide
spectra
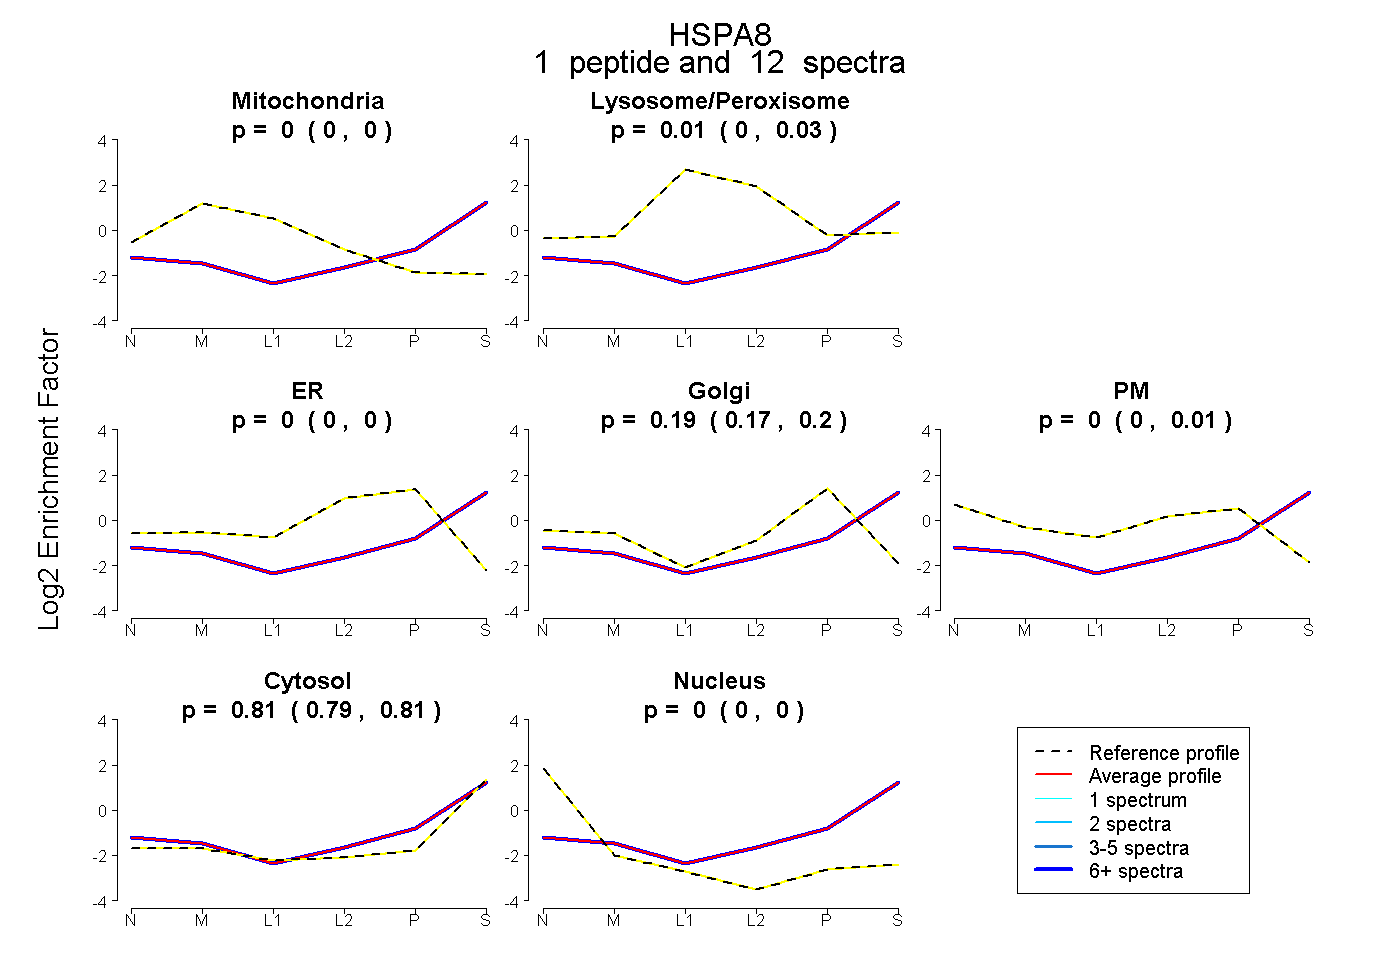
0.000 | 0.000
0.000 | 0.028
0.000 | 0.000
0.166 | 0.197
0.000 | 0.014
0.793 | 0.815
0.000 | 0.000
2peptides
spectra
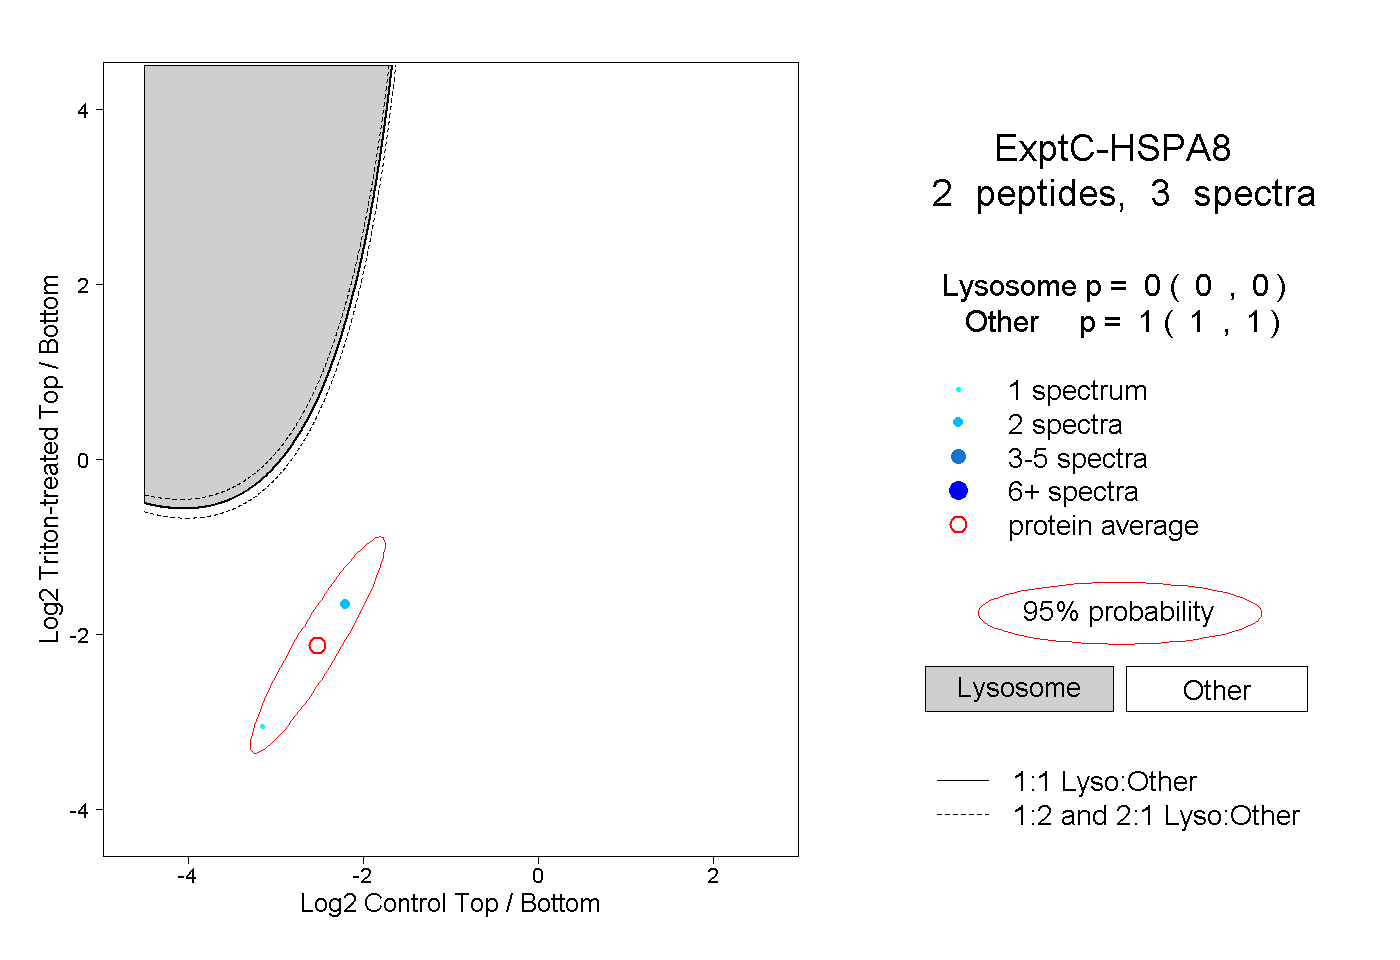
0.000 | 0.000
1.000 | 1.000