 1
1peptide
spectra
0.000 | 0.059
0.000 | 0.000
0.000 | 0.080
0.405 | 0.472
0.000 | 0.000
0.000 | 0.004
0.444 | 0.536
0.000 | 0.041
1peptide
spectra
0.000 | 0.000
1.000 | 1.000
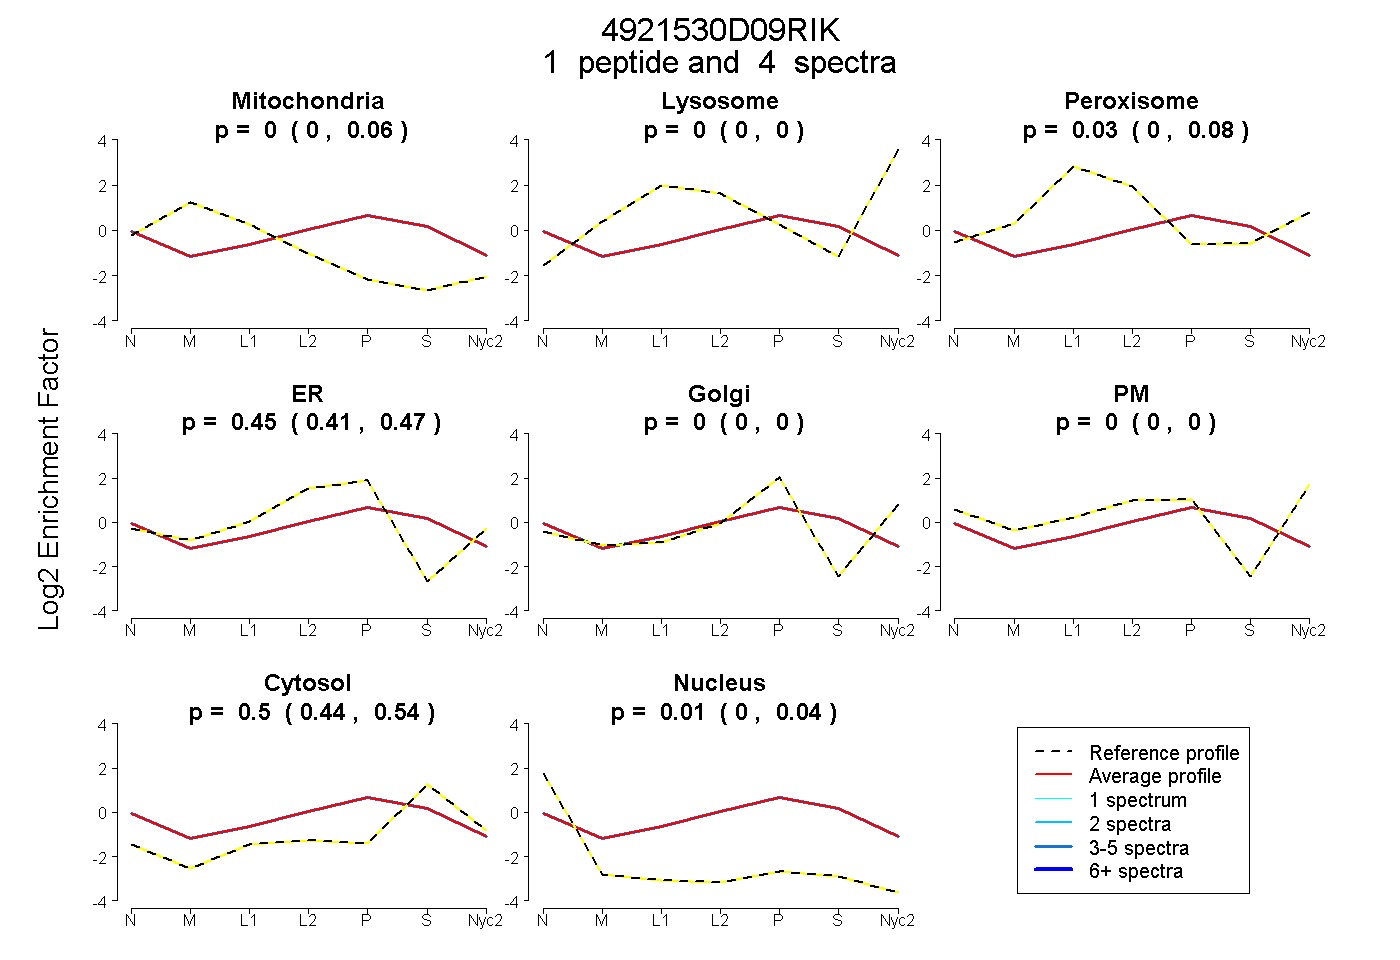
| Plot | Mito | Lyso | Perox | ER | Golgi | PM | Cytosol | Nucleus | |||||
| Expt A |
1 peptide |
4 spectra |
|
0.000 0.000 | 0.059 |
0.000 0.000 | 0.000 |
0.035 0.000 | 0.080 |
0.451 0.405 | 0.472 |
0.000 0.000 | 0.000 |
0.000 0.000 | 0.004 |
0.500 0.444 | 0.536 |
0.014 0.000 | 0.041 |
||
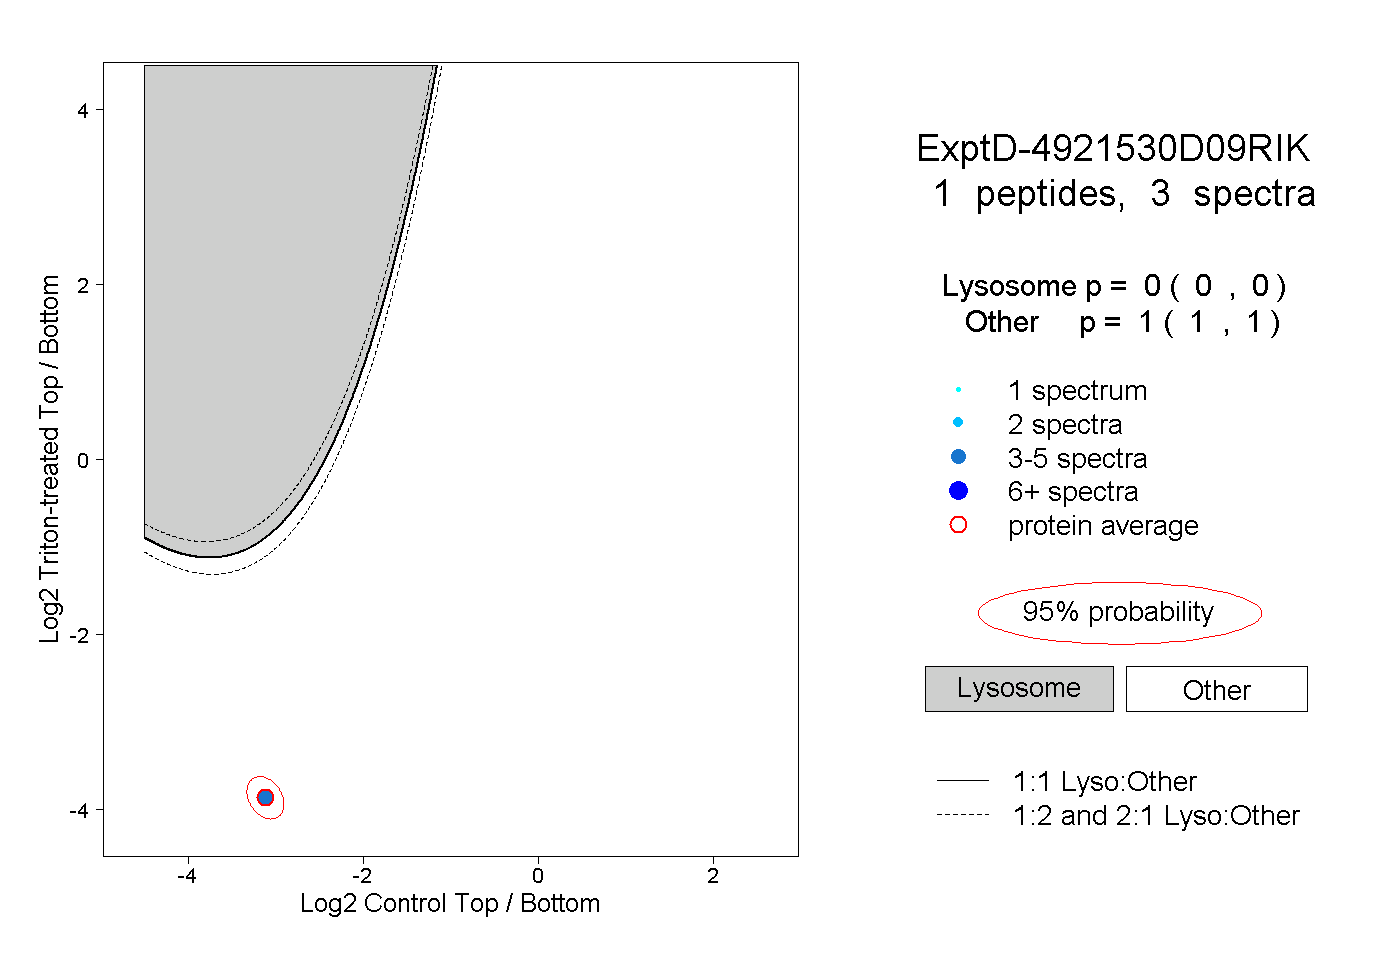
| Plot | Lyso | Other | |||||||||||
| Expt D |
1 peptide |
3 spectra |
|
0.000 0.000 | 0.000 |
1.000 1.000 | 1.000 |