 2
2peptides
spectra
0.000 | 0.000
0.000 | 0.000
0.125 | 0.244
0.000 | 0.026
0.000 | 0.359
0.066 | 0.439
0.275 | 0.427
0.000 | 0.000
2peptides
spectra
NA | NA
NA | NA
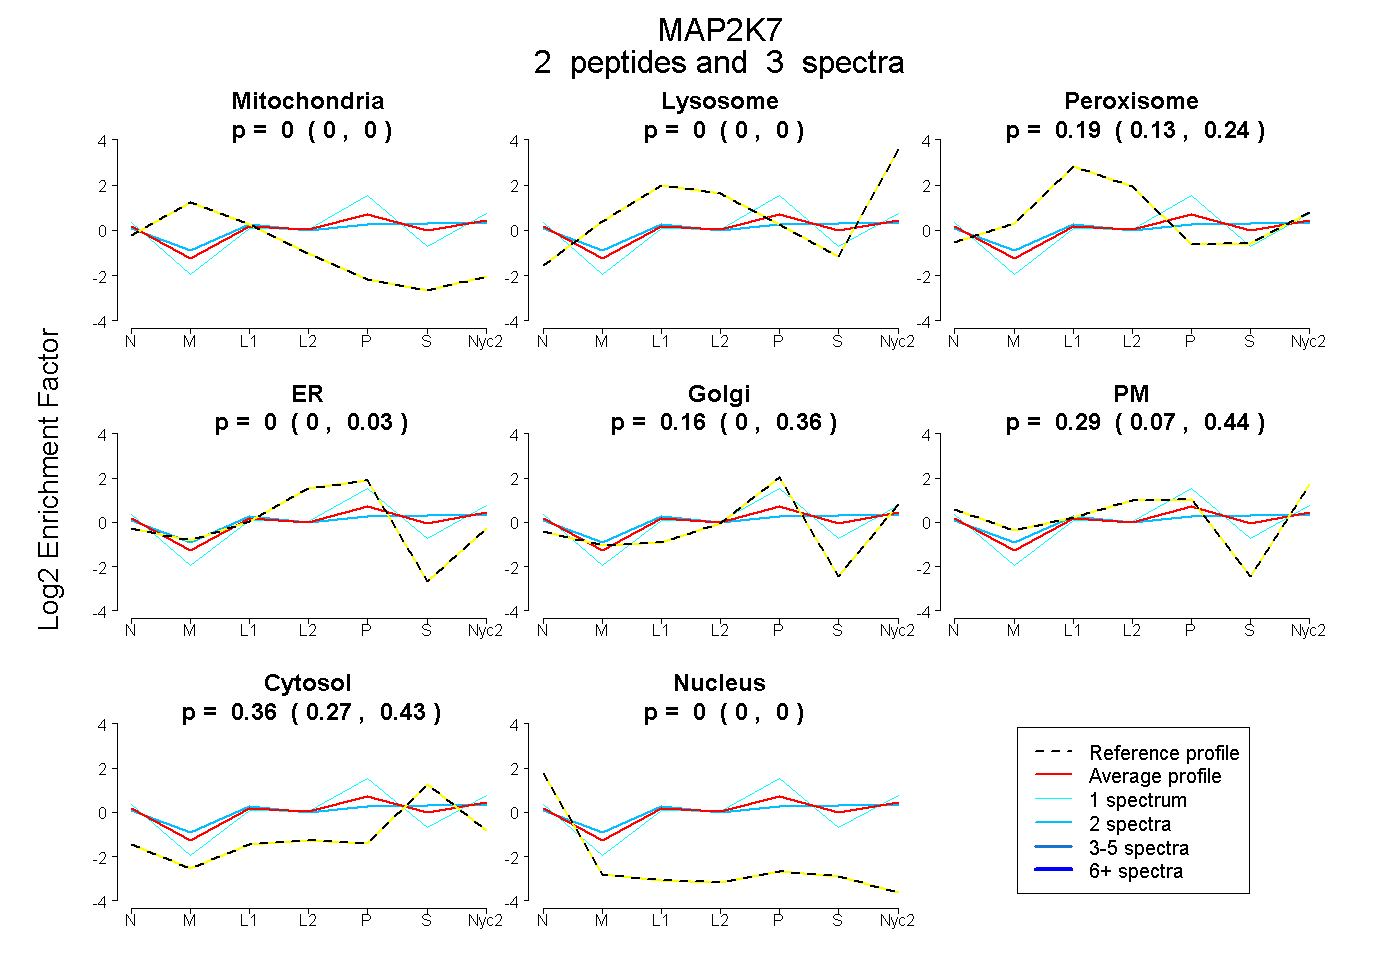
| Plot | Mito | Lyso | Perox | ER | Golgi | PM | Cytosol | Nucleus | |||||
| Expt A |
2 peptides |
3 spectra |
|
0.000 0.000 | 0.000 |
0.000 0.000 | 0.000 |
0.187 0.125 | 0.244 |
0.000 0.000 | 0.026 |
0.161 0.000 | 0.359 |
0.293 0.066 | 0.439 |
0.359 0.275 | 0.427 |
0.000 0.000 | 0.000 |
||
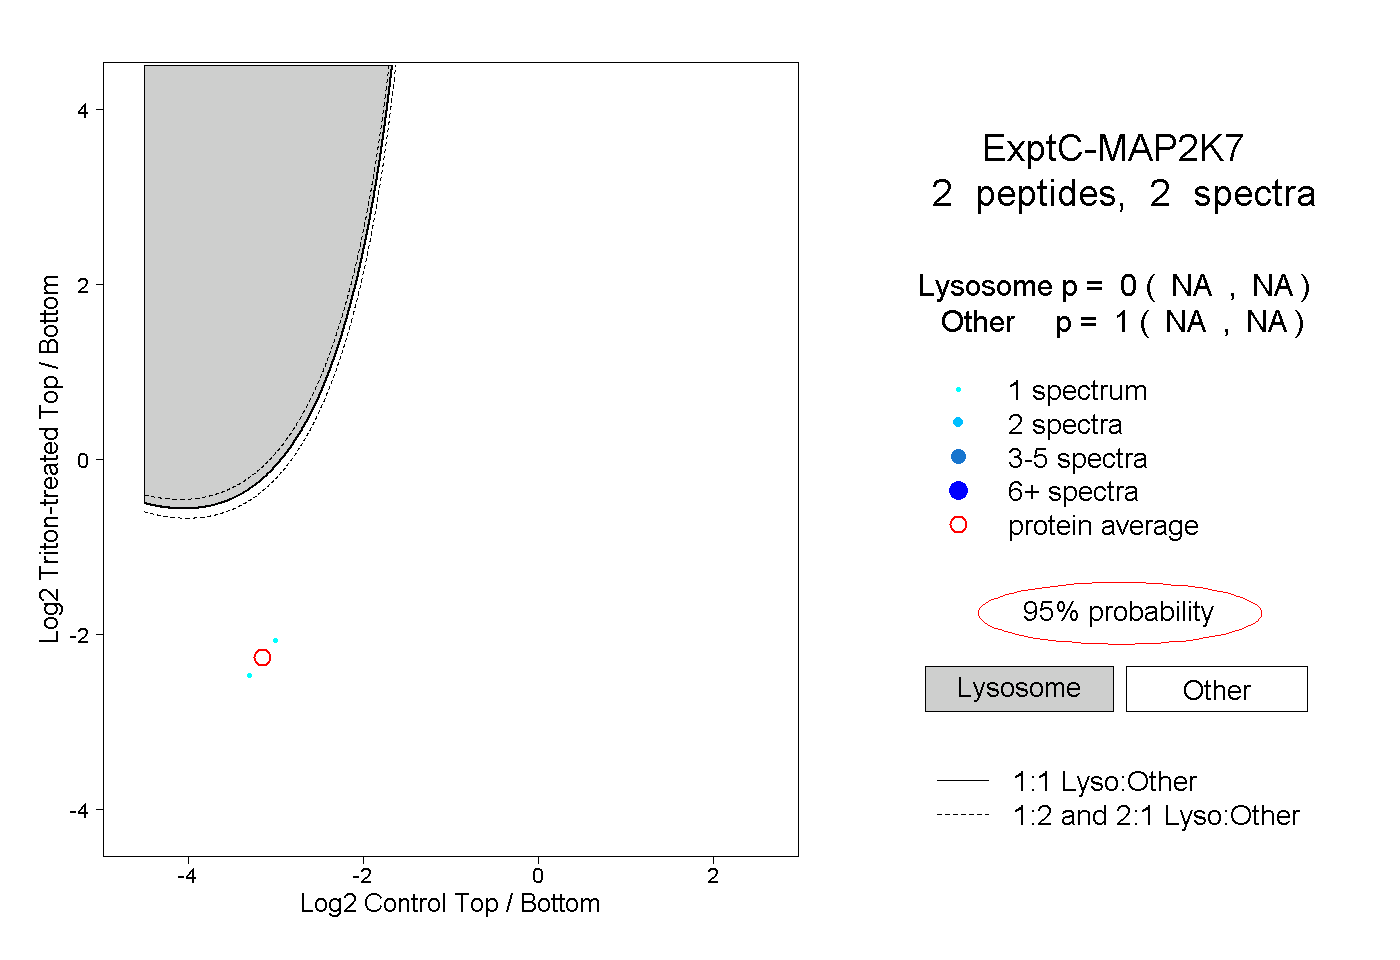
| Plot | Lyso | Other | |||||||||||
| Expt C |
2 peptides |
2 spectra |
|
0.000 NA | NA |
1.000 NA | NA |