 2
2peptides
spectra
0.265 | 0.524
0.000 | 0.303
0.000 | 0.137
0.000 | 0.066
0.000 | 0.311
0.048 | 0.464
0.000 | 0.103
0.000 | 0.141
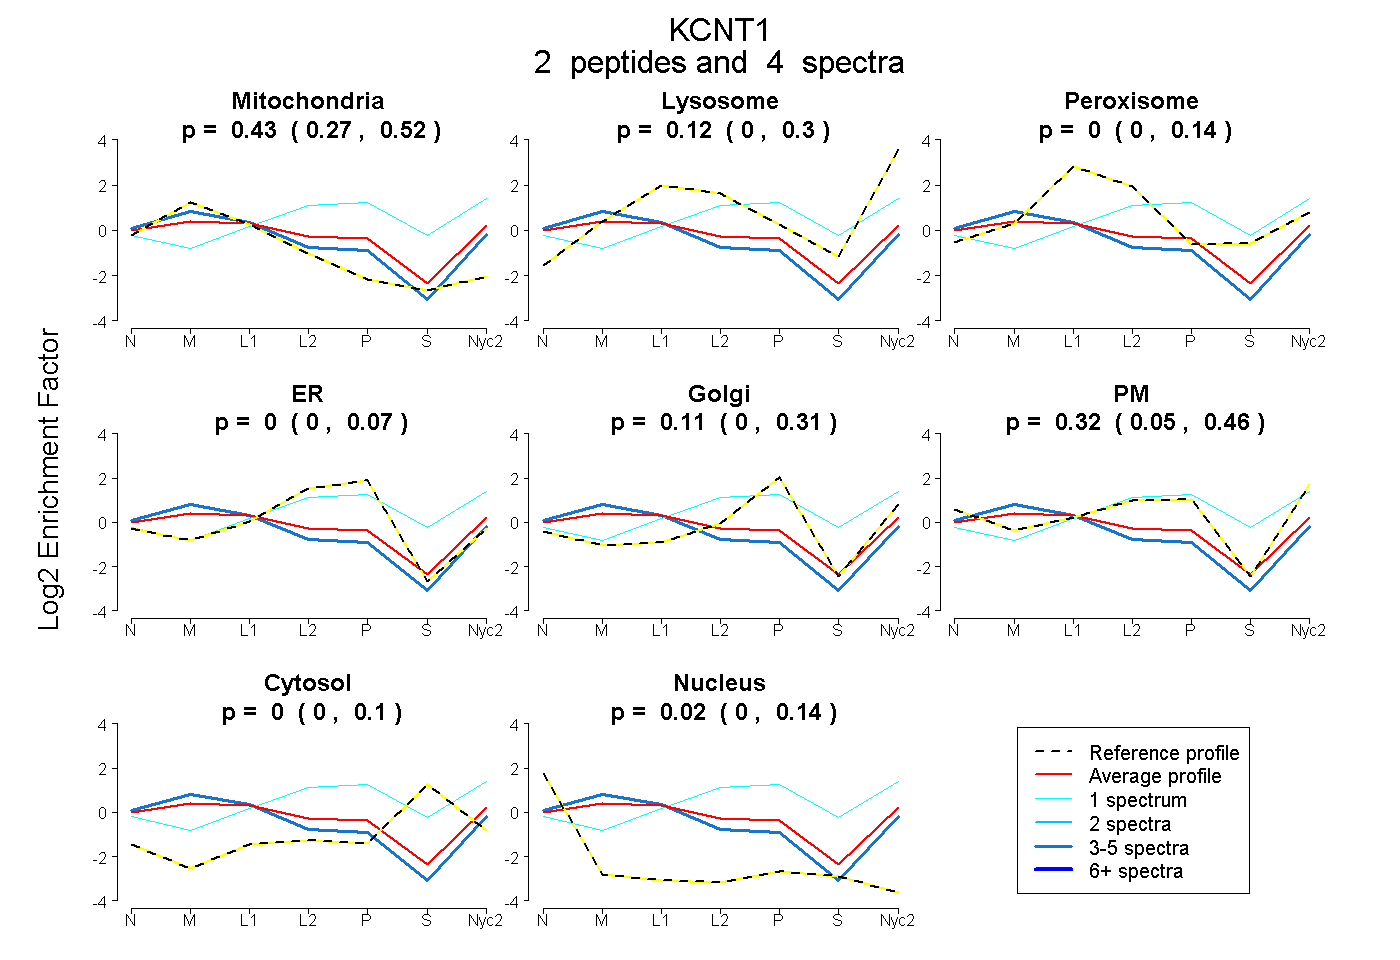
| Plot | Mito | Lyso | Perox | ER | Golgi | PM | Cytosol | Nucleus | |||||
| Expt A |
2 peptides |
4 spectra |
|
0.434 0.265 | 0.524 |
0.116 0.000 | 0.303 |
0.000 0.000 | 0.137 |
0.000 0.000 | 0.066 |
0.108 0.000 | 0.311 |
0.322 0.048 | 0.464 |
0.000 0.000 | 0.103 |
0.020 0.000 | 0.141 |
| 1 spectrum, SLQWAR | 0.000 | 0.291 | 0.000 | 0.198 | 0.010 | 0.269 | 0.233 | 0.000 | ||
| 3 spectra, LSLYR | 0.605 | 0.005 | 0.000 | 0.000 | 0.000 | 0.389 | 0.000 | 0.000 |