 6
6peptides
spectra
0.540 | 0.606
0.000 | 0.000
0.068 | 0.133
0.052 | 0.130
0.000 | 0.000
0.000 | 0.000
0.196 | 0.248
0.000 | 0.000
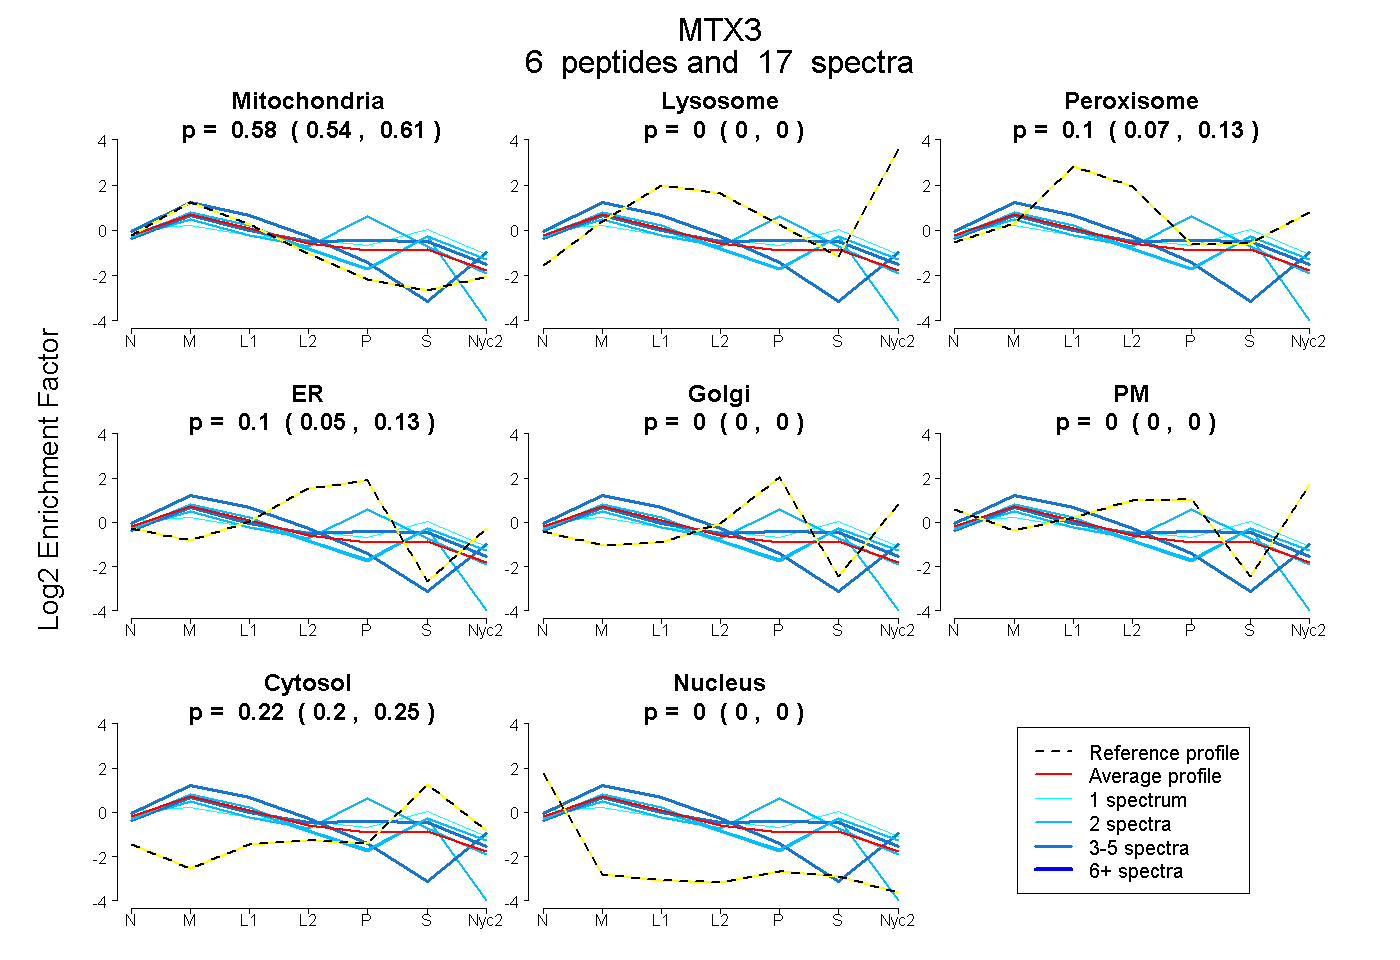
| Plot | Mito | Lyso | Perox | ER | Golgi | PM | Cytosol | Nucleus | |||||
| Expt A |
6 peptides |
17 spectra |
|
0.576 0.540 | 0.606 |
0.000 0.000 | 0.000 |
0.104 0.068 | 0.133 |
0.095 0.052 | 0.130 |
0.000 0.000 | 0.000 |
0.000 0.000 | 0.000 |
0.225 0.196 | 0.248 |
0.000 0.000 | 0.000 |
| 2 spectra, QLPNLCR | 0.398 | 0.000 | 0.000 | 0.321 | 0.035 | 0.000 | 0.246 | 0.000 | ||
| 5 spectra, QGADTLAYIALLEEK | 0.751 | 0.051 | 0.000 | 0.000 | 0.000 | 0.198 | 0.000 | 0.000 | ||
| 5 spectra, VHLQEHLK | 0.451 | 0.000 | 0.127 | 0.151 | 0.000 | 0.000 | 0.272 | 0.000 | ||
| 2 spectra, LCDDILDSYFR | 0.728 | 0.000 | 0.000 | 0.000 | 0.000 | 0.000 | 0.255 | 0.017 | ||
| 2 spectra, VNIIDNTWR | 0.536 | 0.000 | 0.176 | 0.000 | 0.000 | 0.000 | 0.288 | 0.000 | ||
| 1 spectrum, ECLNLLSNR | 0.341 | 0.000 | 0.166 | 0.038 | 0.000 | 0.076 | 0.379 | 0.000 |
| Plot | Lyso | Other | |||||||||||
| Expt C |
5 peptides |
17 spectra |
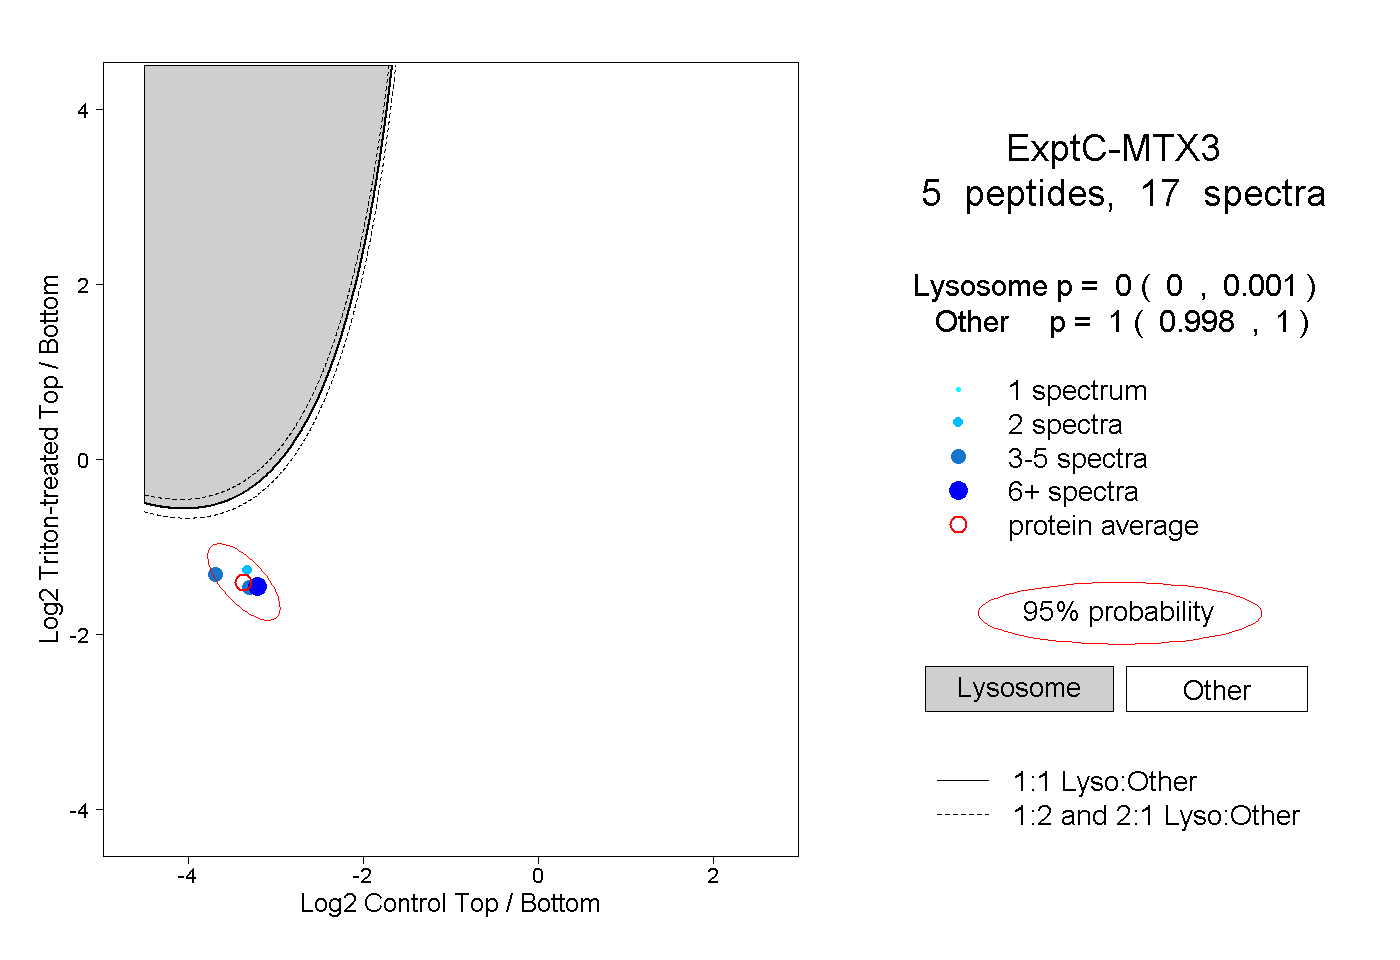 |
0.000 0.000 | 0.001 |
1.000 0.998 | 1.000 |
||||||||
| Plot | Lyso | Other | |||||||||||
| Expt D |
2 peptides |
3 spectra |
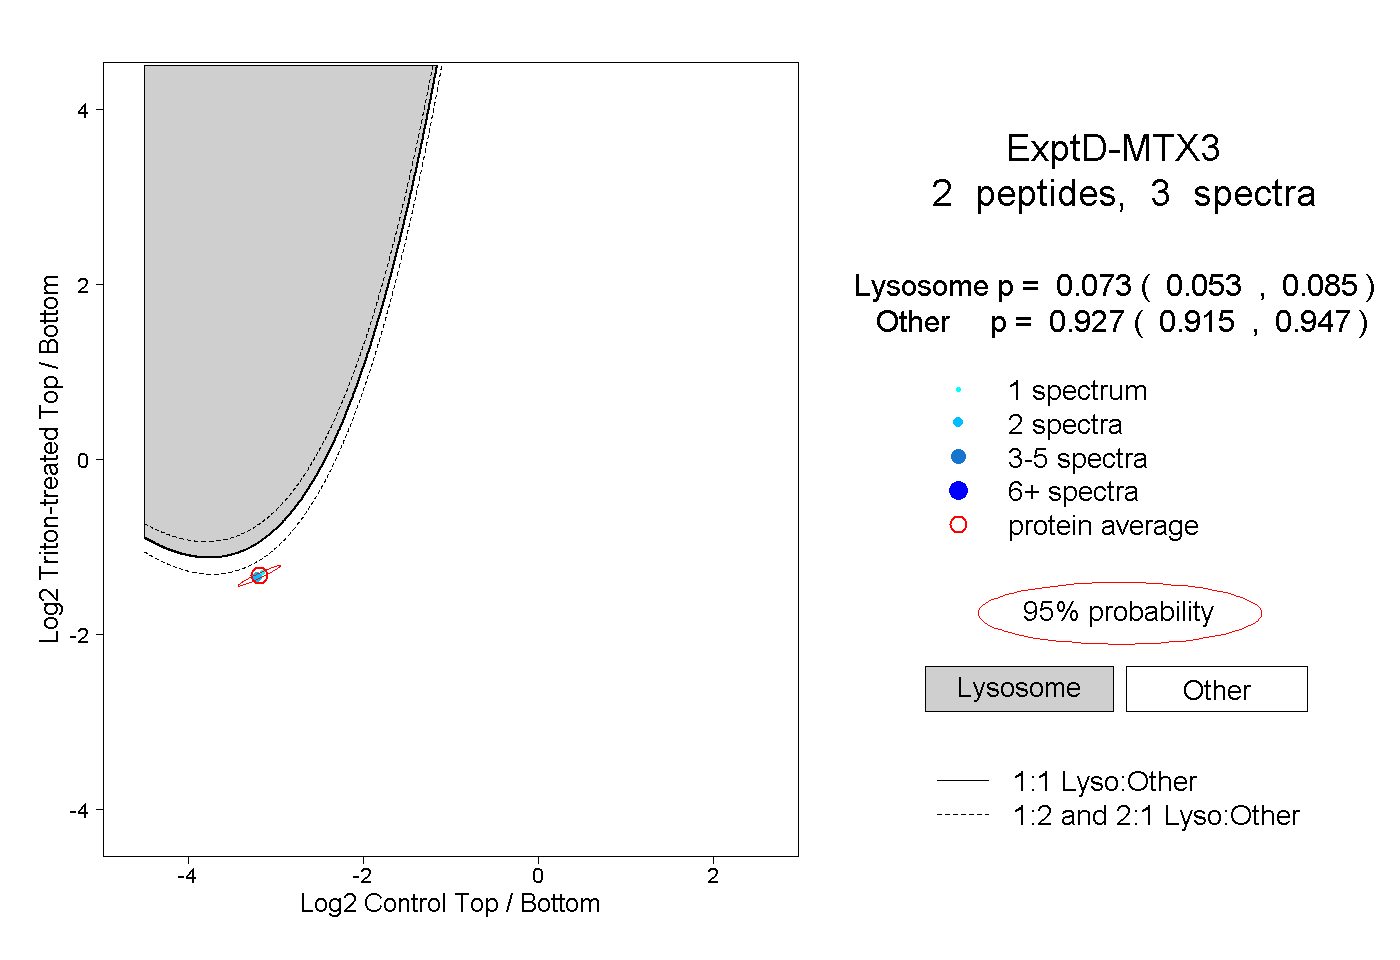 |
0.073 0.053 | 0.085 |
0.927 0.915 | 0.947 |