 4
4peptides
spectra
0.000 | 0.146
0.000 | 0.007
0.000 | 0.000
0.000 | 0.676
0.000 | 0.548
0.000 | 0.454
0.000 | 0.181
0.000 | 0.113
4peptides
spectra
0.000 | 0.000
1.000 | 1.000
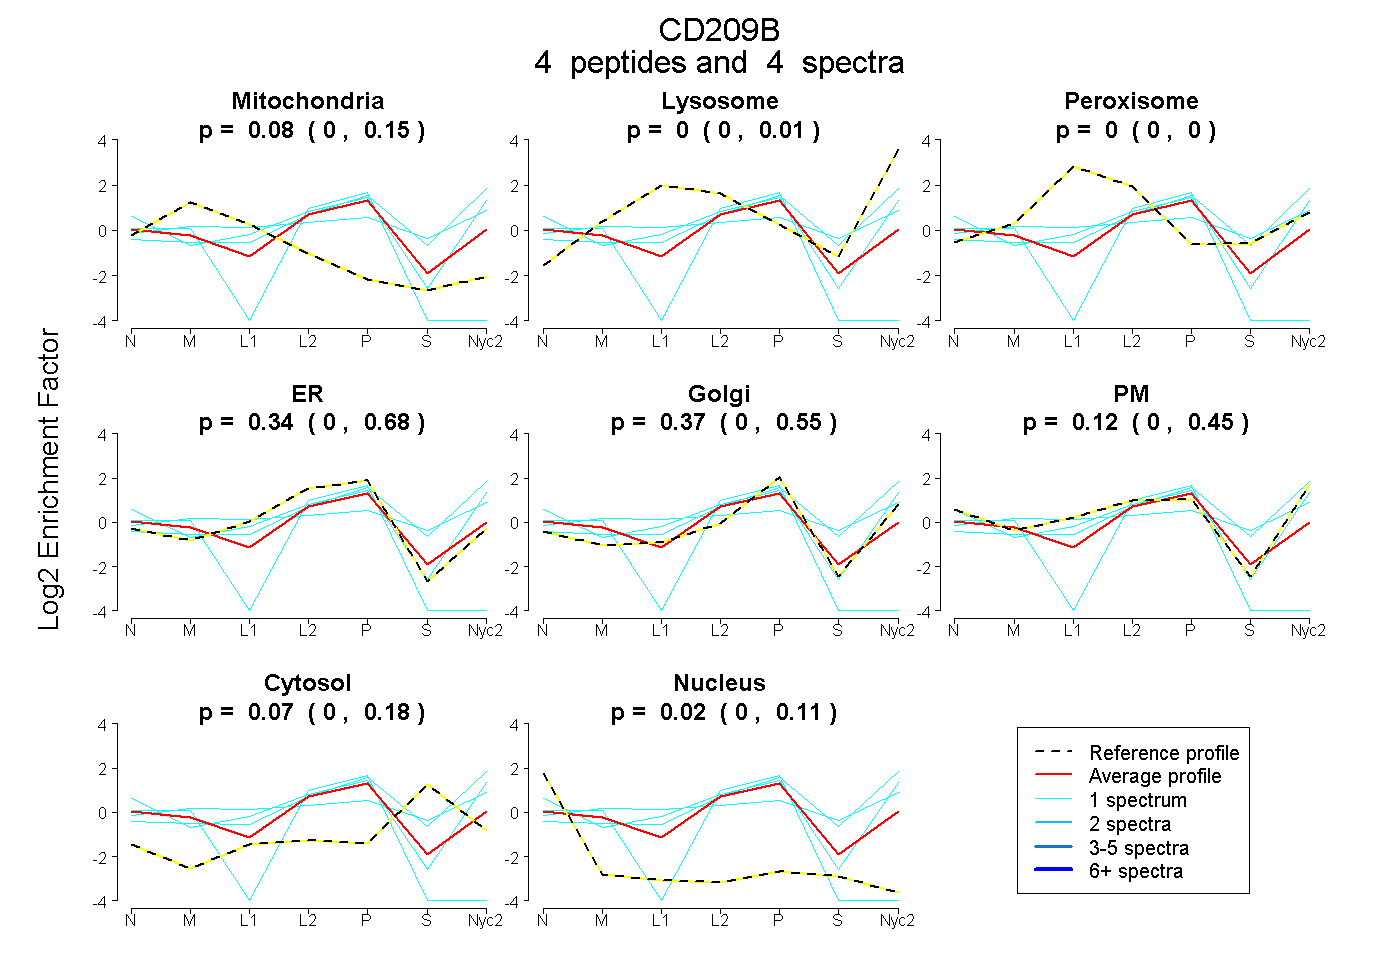
| Plot | Mito | Lyso | Perox | ER | Golgi | PM | Cytosol | Nucleus | |||||
| Expt A |
4 peptides |
4 spectra |
|
0.083 0.000 | 0.146 |
0.000 0.000 | 0.007 |
0.000 0.000 | 0.000 |
0.341 0.000 | 0.676 |
0.365 0.000 | 0.548 |
0.123 0.000 | 0.454 |
0.070 0.000 | 0.181 |
0.018 0.000 | 0.113 |
||
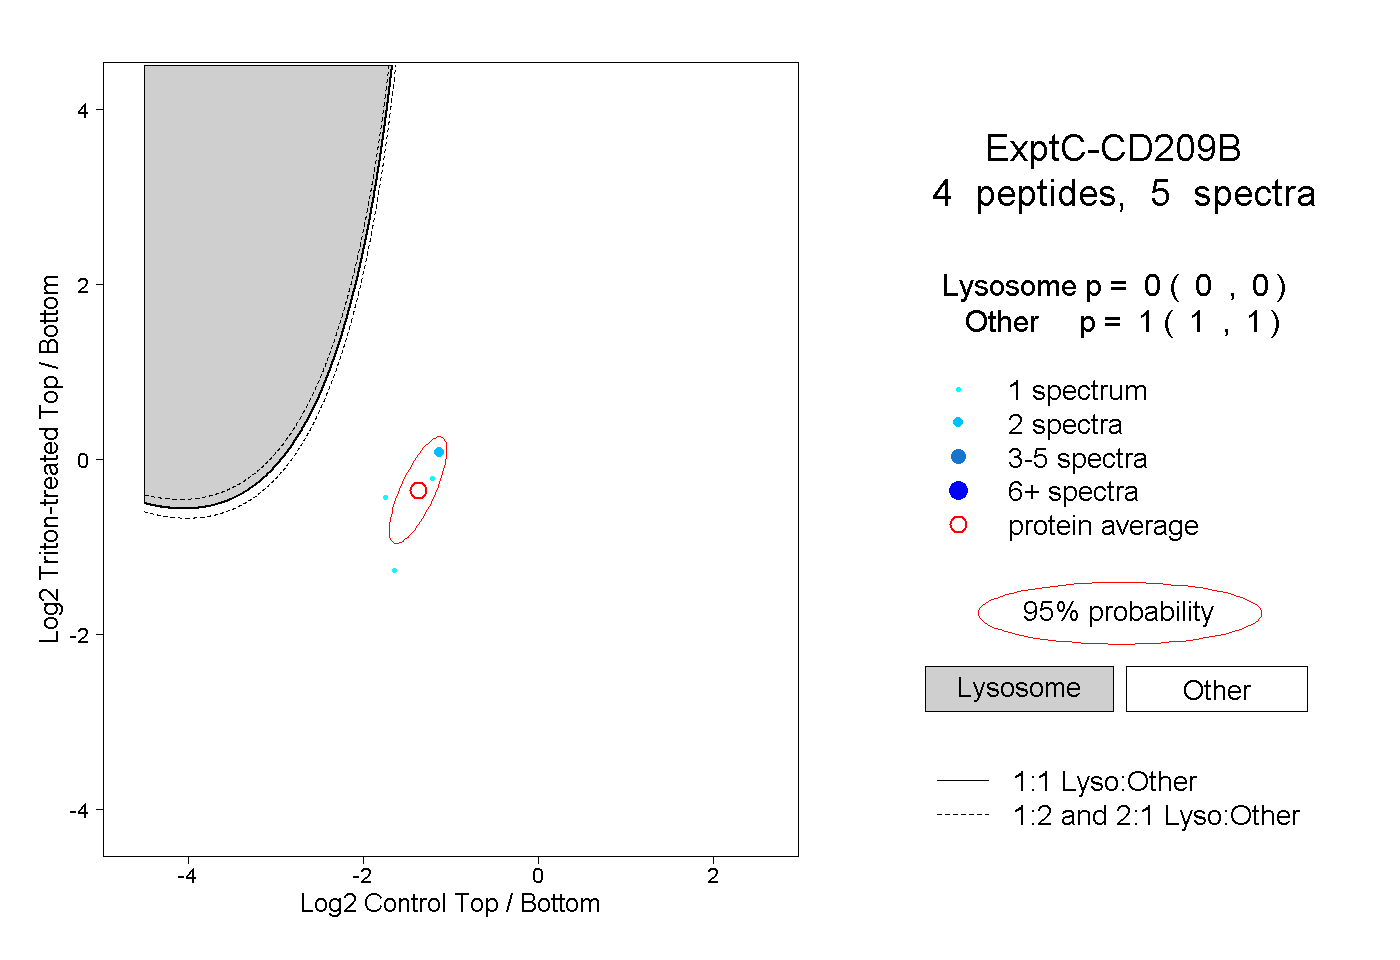
| Plot | Lyso | Other | |||||||||||
| Expt C |
4 peptides |
5 spectra |
|
0.000 0.000 | 0.000 |
1.000 1.000 | 1.000 |