 5
5peptides
spectra
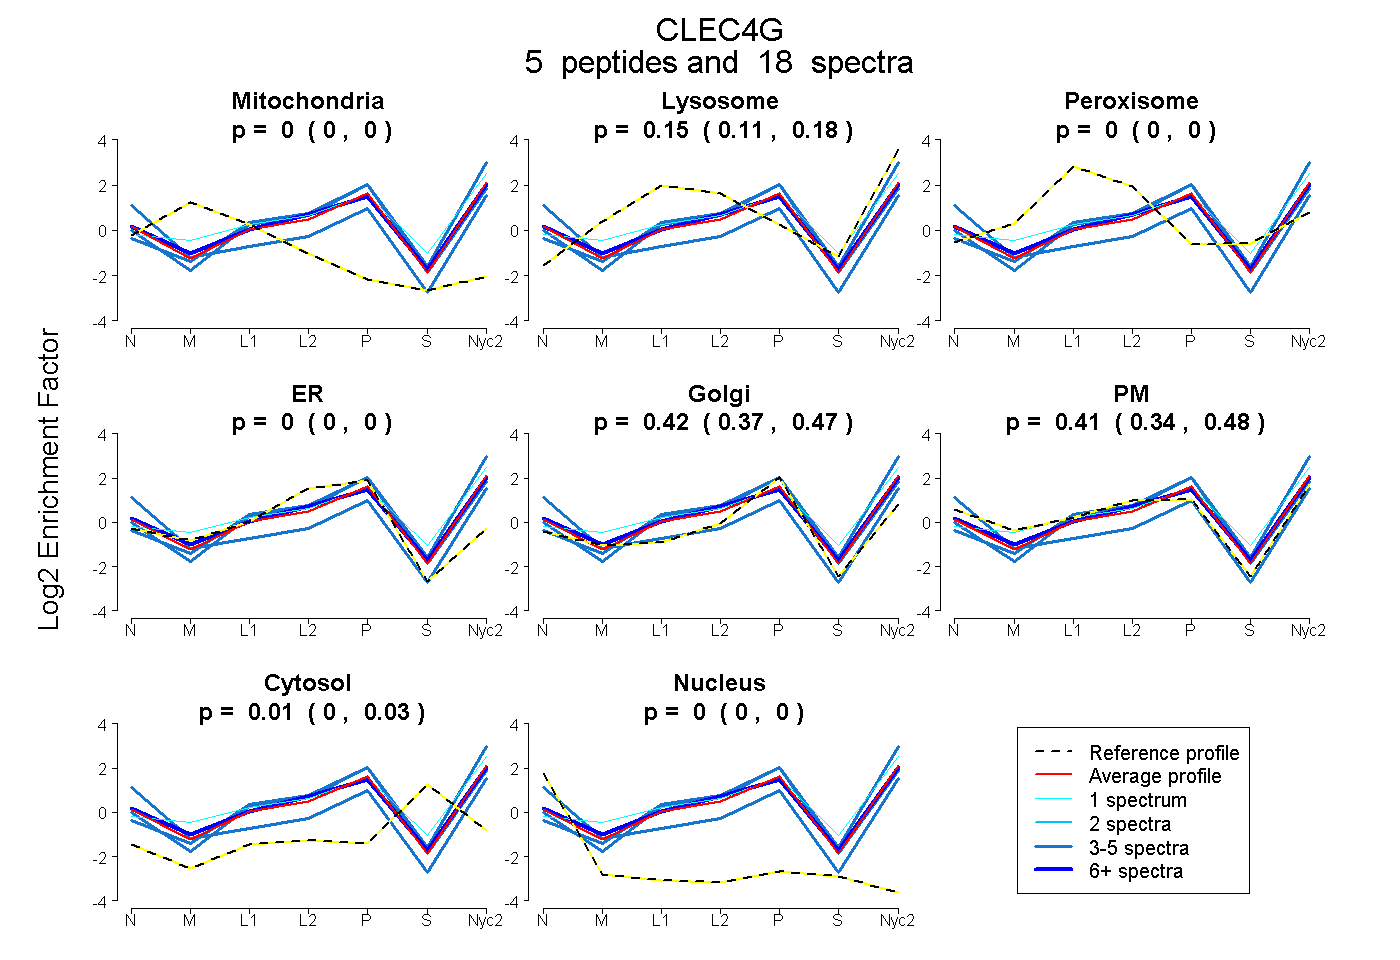
0.000 | 0.000
0.114 | 0.177
0.000 | 0.000
0.000 | 0.000
0.368 | 0.473
0.339 | 0.476
0.000 | 0.030
0.000 | 0.000
3peptides
spectra
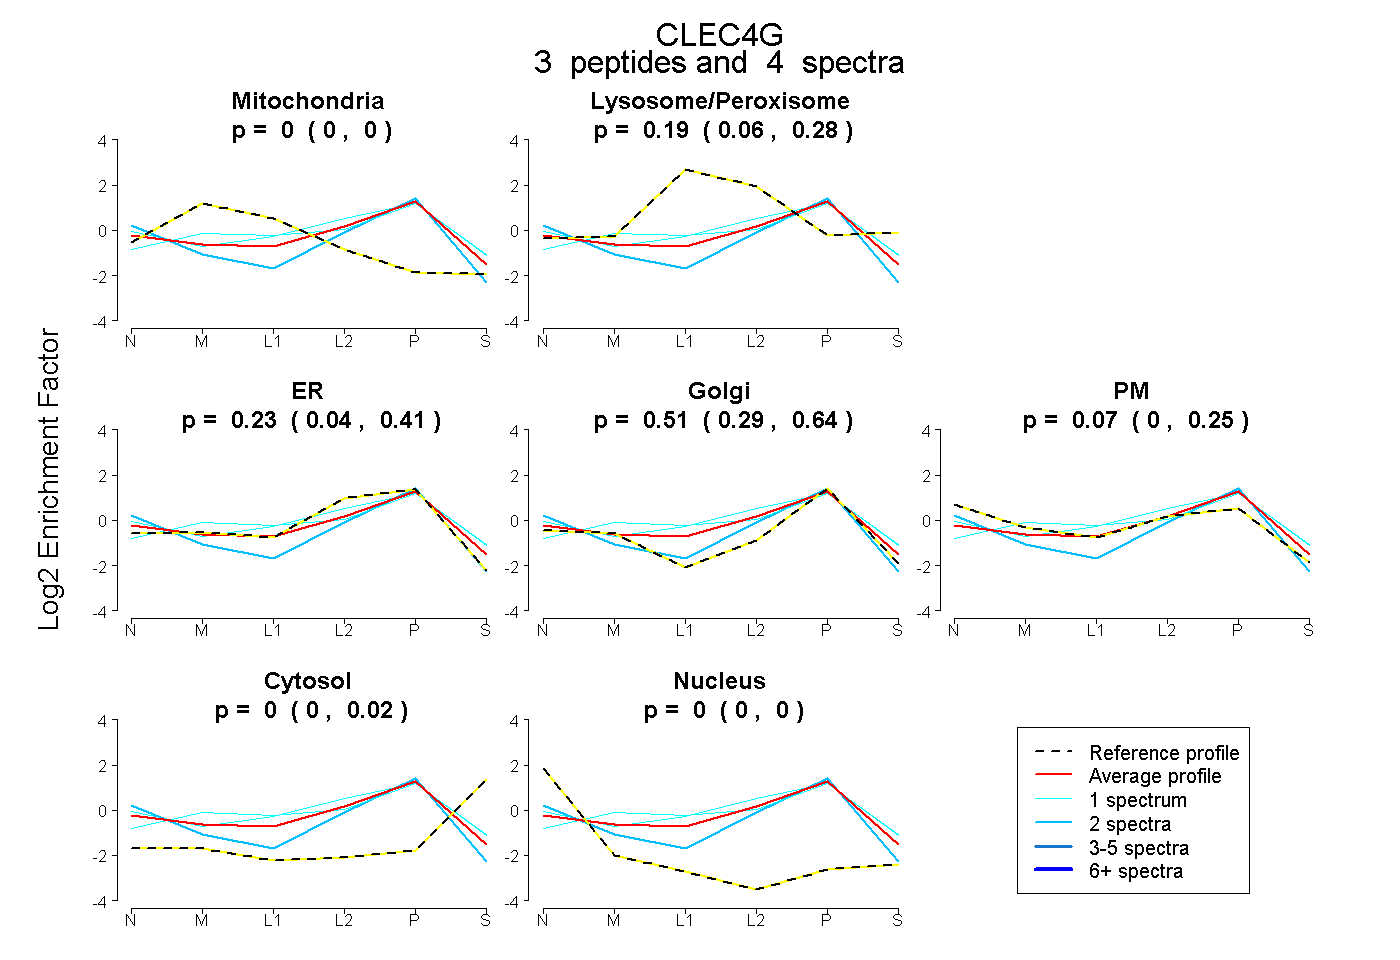
0.000 | 0.000
0.061 | 0.284
0.037 | 0.415
0.291 | 0.637
0.000 | 0.249
0.000 | 0.020
0.000 | 0.000
4peptides
spectra
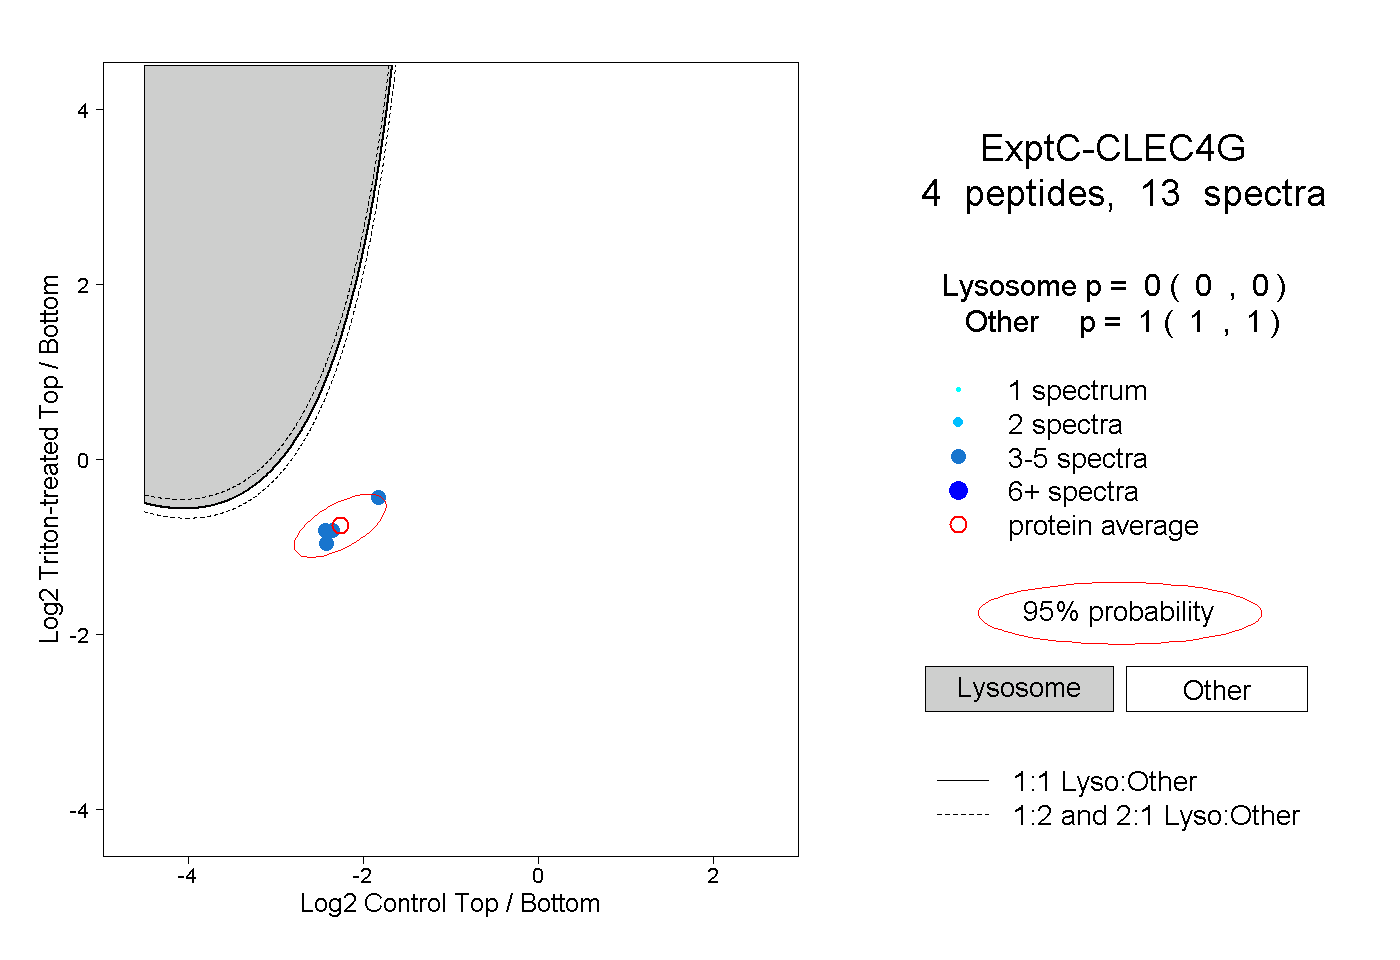
0.000 | 0.000
1.000 | 1.000
1peptide
spectrum
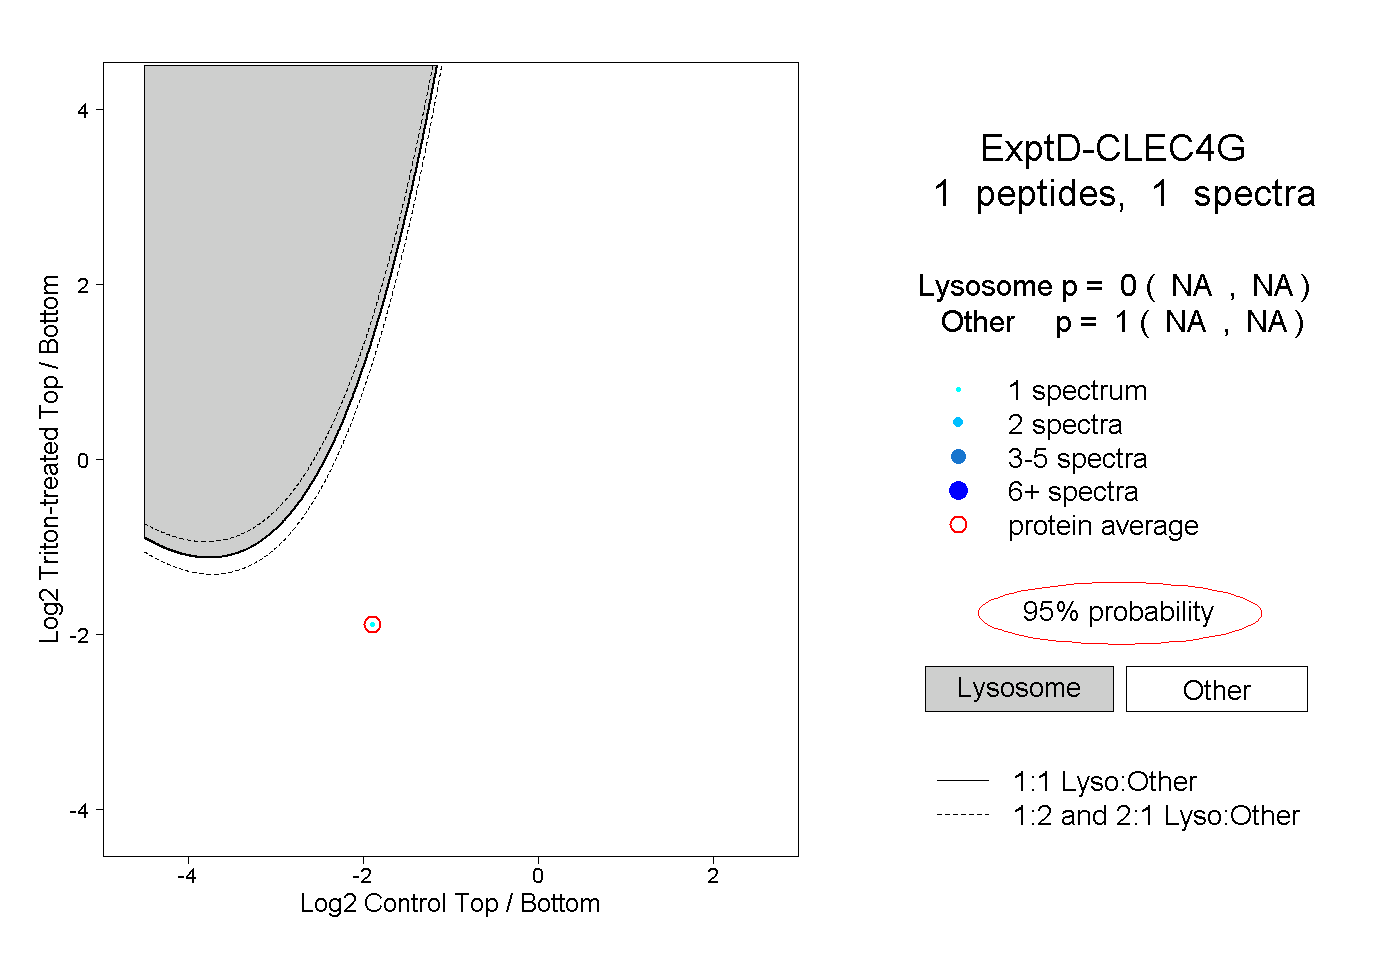
NA | NA
NA | NA