 5
5peptides
spectra
0.000 | 0.000
0.114 | 0.177
0.000 | 0.000
0.000 | 0.000
0.368 | 0.473
0.339 | 0.476
0.000 | 0.030
0.000 | 0.000
| Plot | Mito | Lyso | Perox | ER | Golgi | PM | Cytosol | Nucleus | |||||
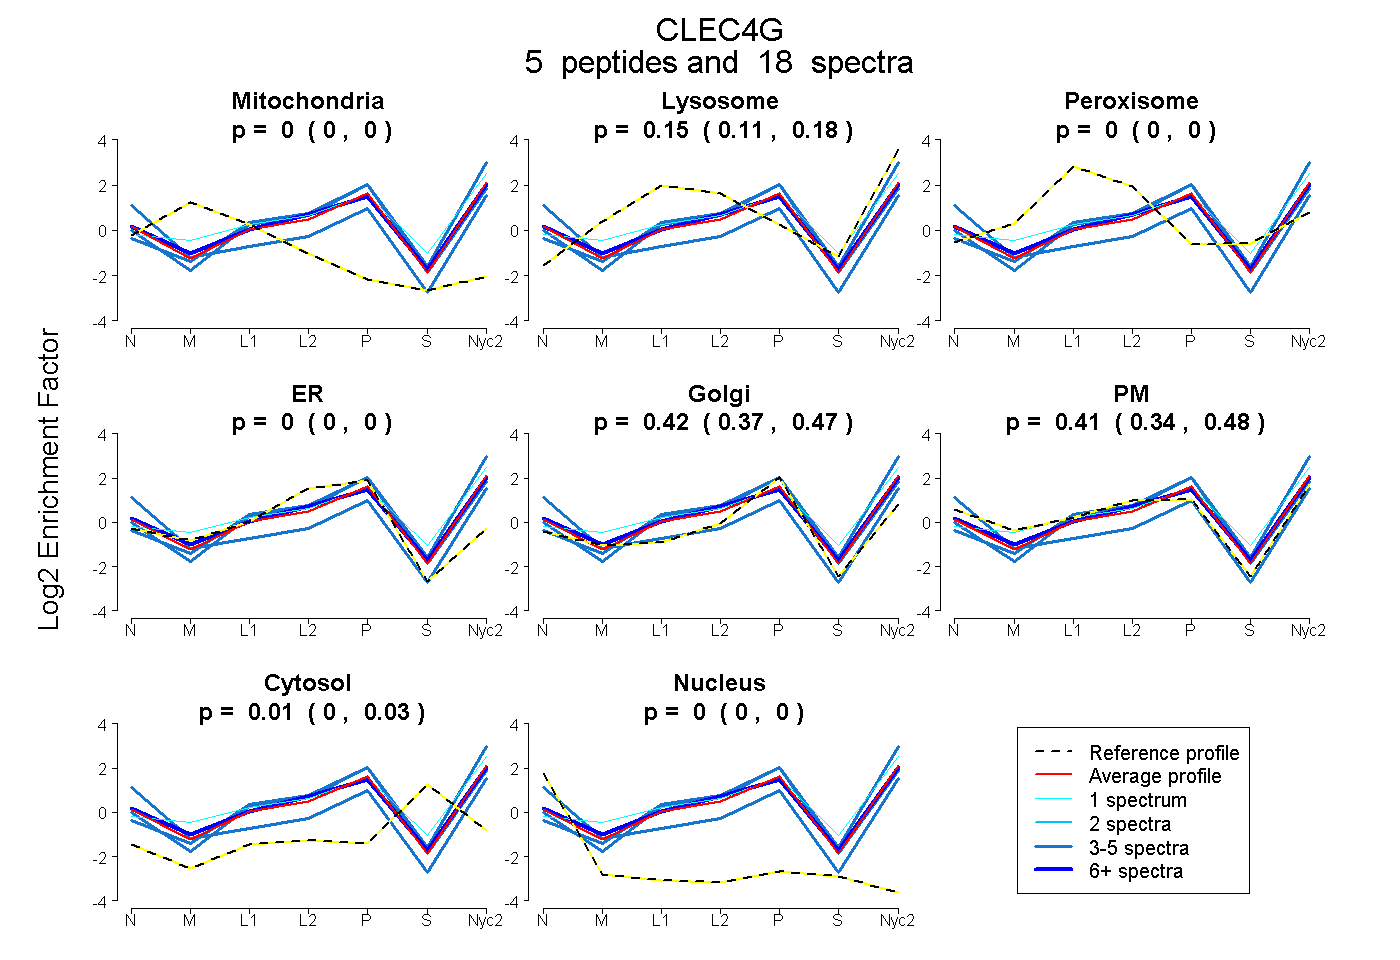
| Expt A |
5 peptides |
18 spectra |
|
0.000 0.000 | 0.000 |
0.148 0.114 | 0.177 |
0.000 0.000 | 0.000 |
0.000 0.000 | 0.000 |
0.423 0.368 | 0.473 |
0.415 0.339 | 0.476 |
0.015 0.000 | 0.030 |
0.000 0.000 | 0.000 |
| 3 spectra, DGWICEK | 0.000 | 0.000 | 0.000 | 0.000 | 0.211 | 0.657 | 0.000 | 0.132 | ||
| 1 spectrum, VTQDLAK | 0.000 | 0.388 | 0.000 | 0.000 | 0.370 | 0.206 | 0.036 | 0.000 | ||
| 3 spectra, AQLQTTLAEFK | 0.000 | 0.408 | 0.000 | 0.000 | 0.534 | 0.058 | 0.000 | 0.000 | ||
| 7 spectra, VLLNHQDLLR | 0.000 | 0.154 | 0.000 | 0.000 | 0.313 | 0.496 | 0.037 | 0.000 | ||
| 4 spectra, LGGVIEEAPR | 0.000 | 0.164 | 0.000 | 0.000 | 0.585 | 0.251 | 0.000 | 0.000 |
| Plot | Mito | Lyso or Perox | ER | Golgi | PM | Cytosol | Nucleus | ||||||
| Expt B |
3 peptides |
4 spectra |
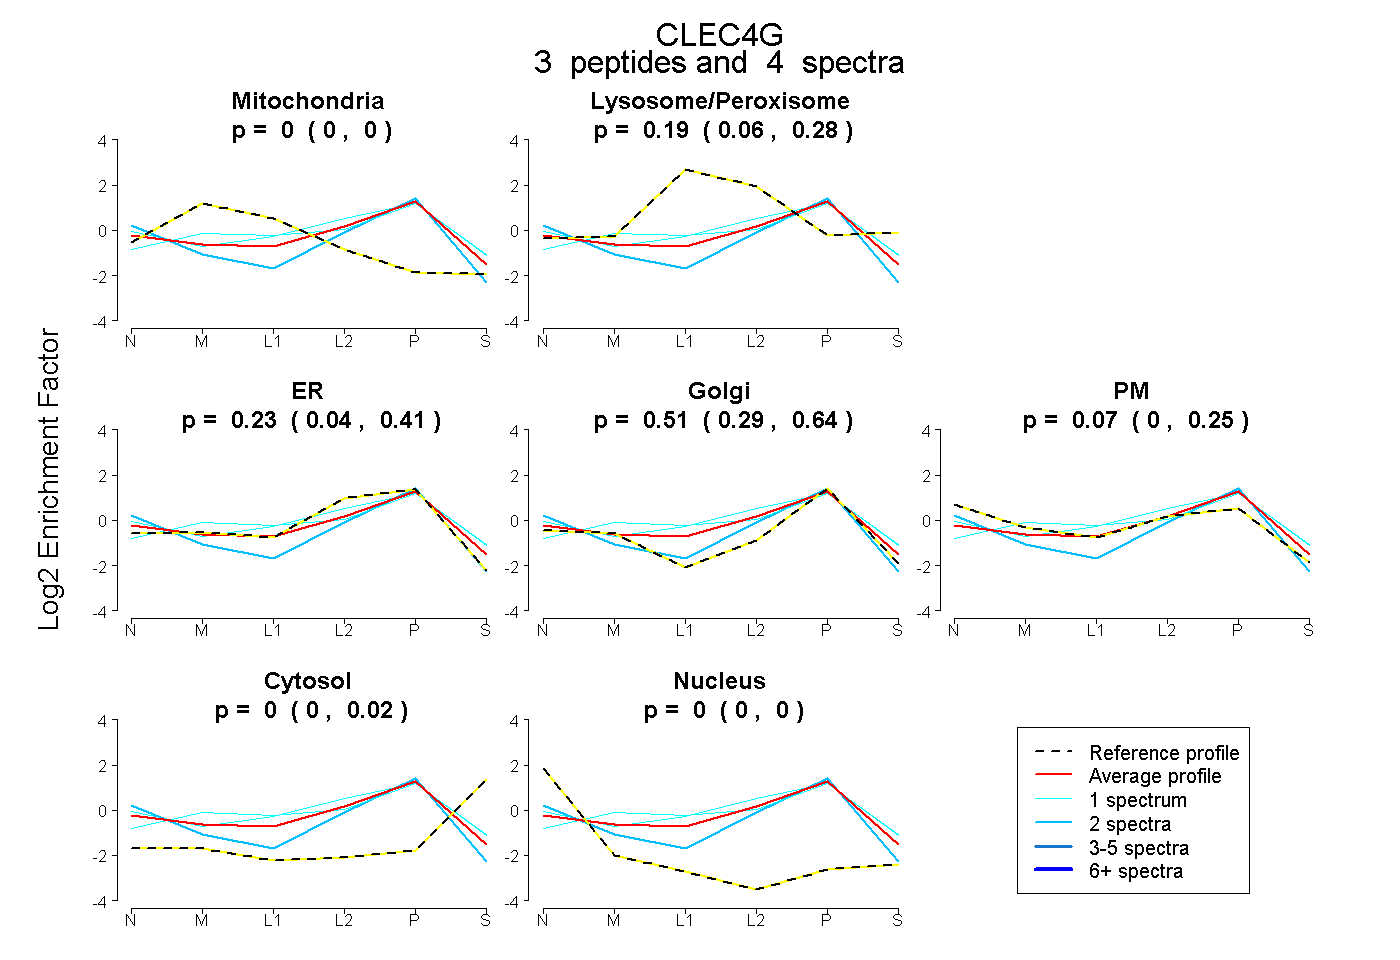 |
0.000 0.000 | 0.000 |
0.191 0.061 | 0.284 |
0.227 0.037 | 0.415 |
0.509 0.291 | 0.637 |
0.073 0.000 | 0.249 |
0.000 0.000 | 0.020 |
0.000 0.000 | 0.000 |
|||
| Plot | Lyso | Other | |||||||||||
| Expt C |
4 peptides |
13 spectra |
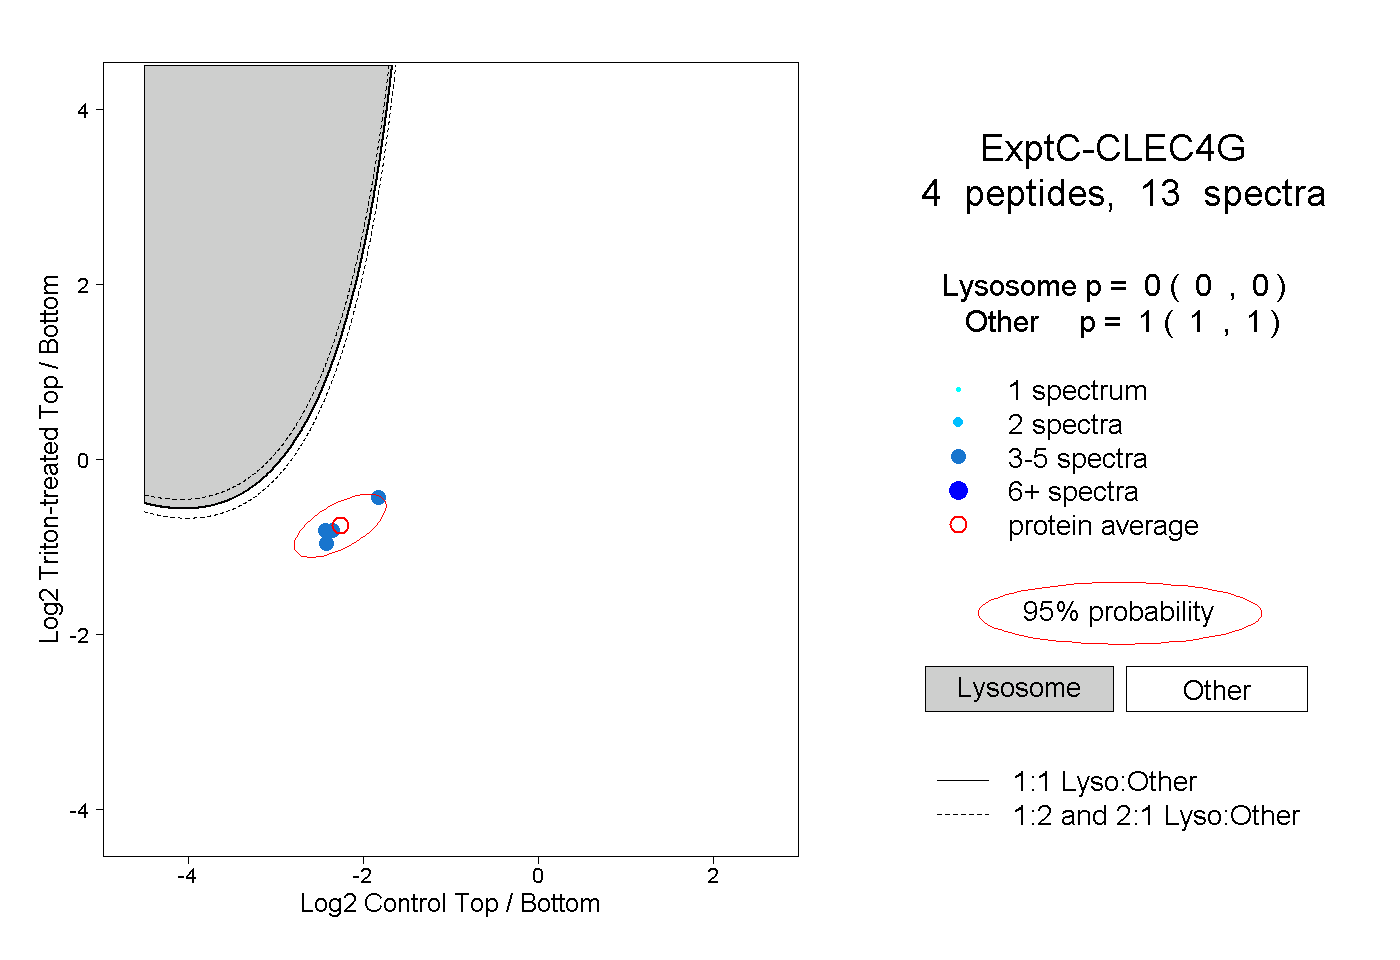 |
0.000 0.000 | 0.000 |
1.000 1.000 | 1.000 |
||||||||
| Plot | Lyso | Other | |||||||||||
| Expt D |
1 peptide |
1 spectrum |
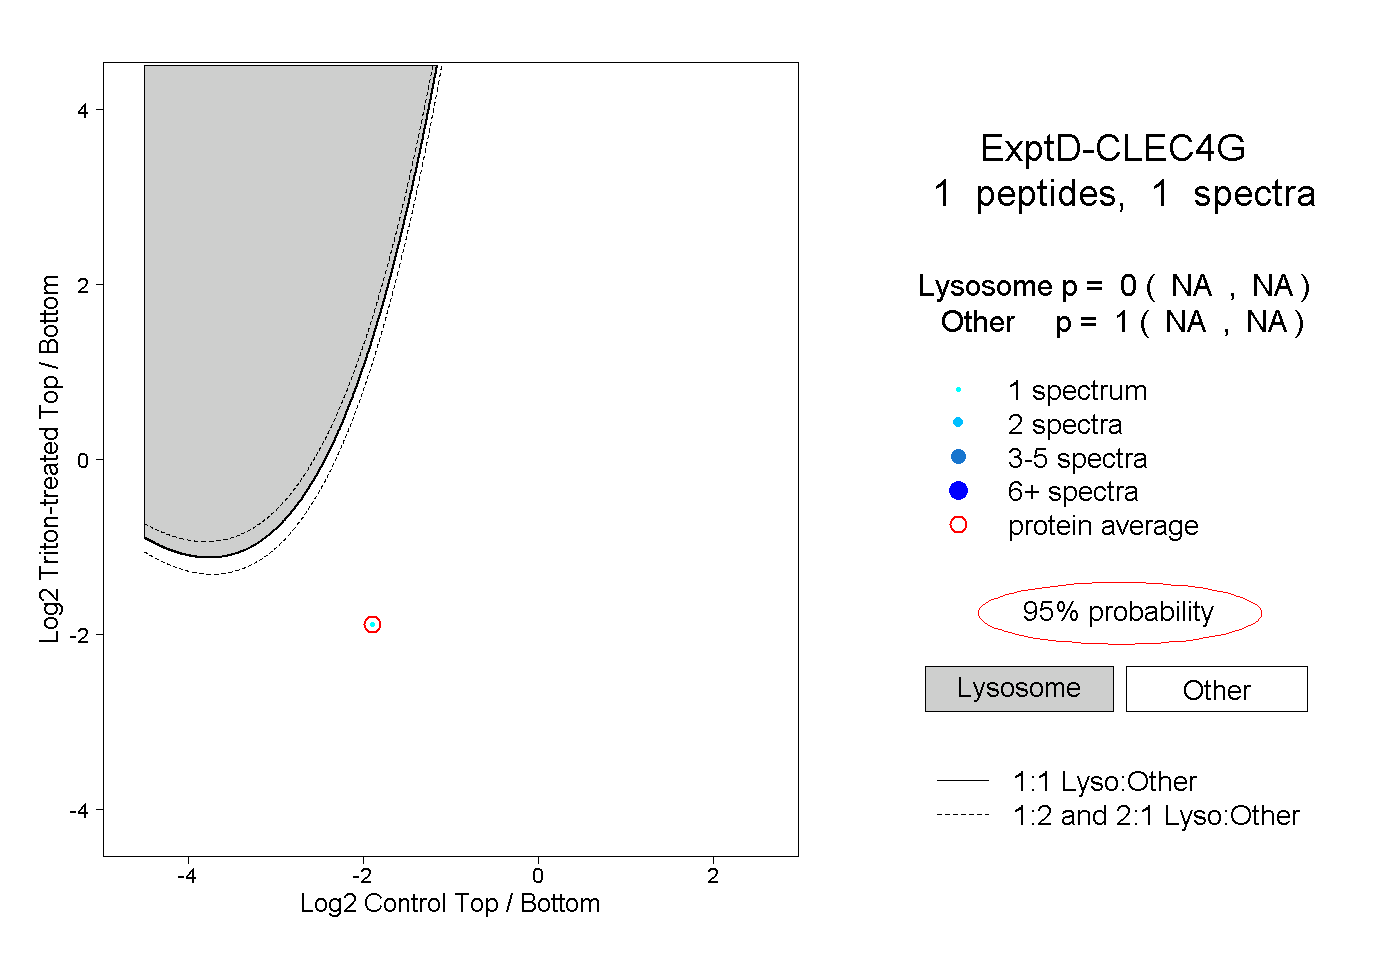 |
0.000 NA | NA |
1.000 NA | NA |