 2
2peptides
spectra
NA | NA
NA | NA
NA | NA
NA | NA
NA | NA
NA | NA
NA | NA
NA | NA
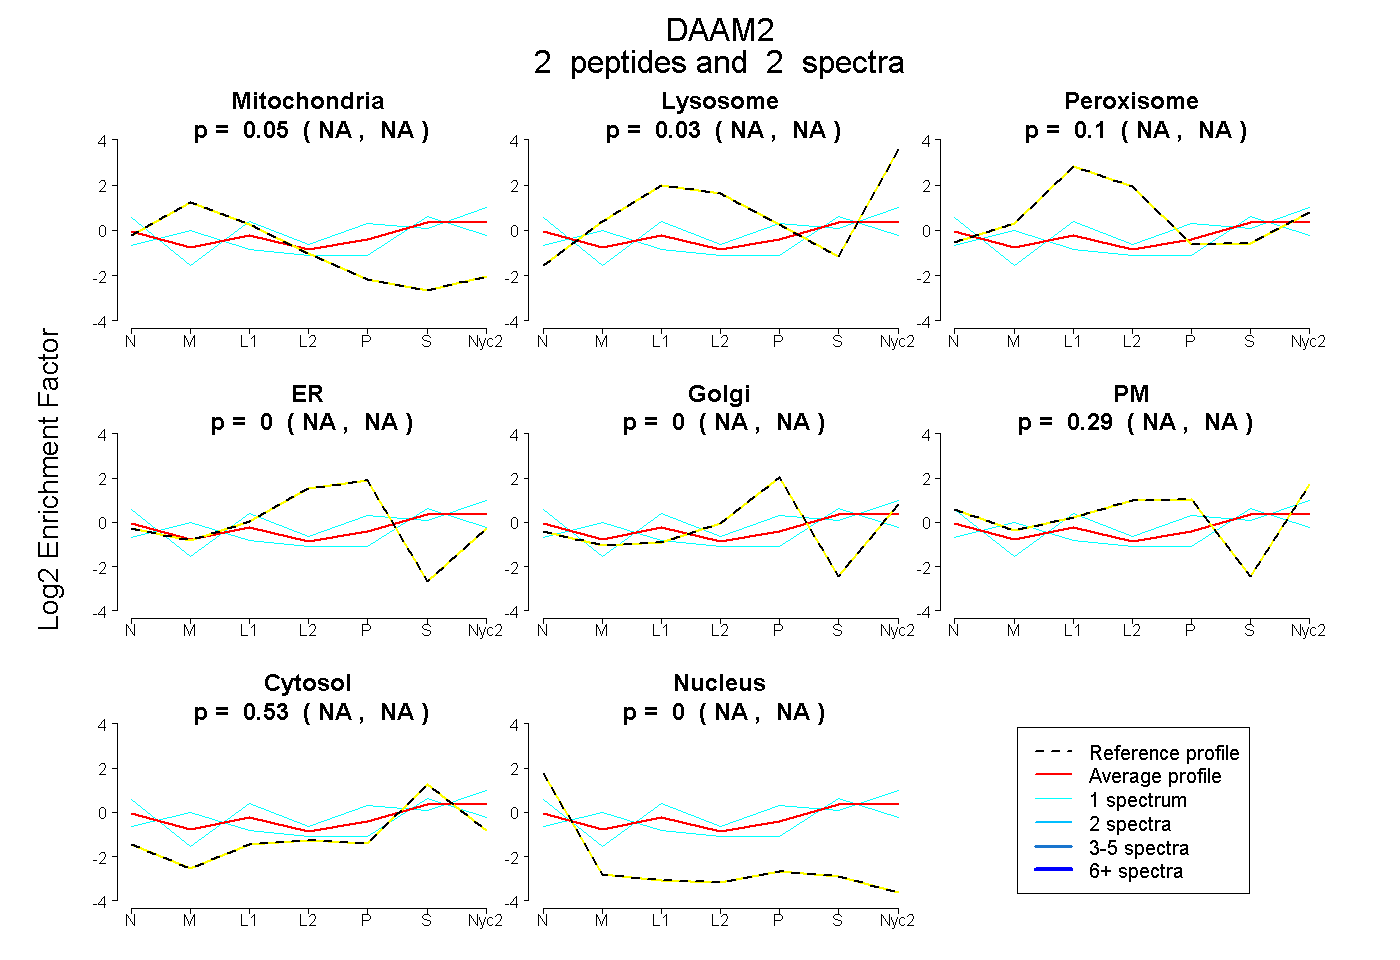
| Plot | Mito | Lyso | Perox | ER | Golgi | PM | Cytosol | Nucleus | |||||
| Expt A |
2 peptides |
2 spectra |
|
0.055 NA | NA |
0.034 NA | NA |
0.097 NA | NA |
0.000 NA | NA |
0.000 NA | NA |
0.288 NA | NA |
0.526 NA | NA |
0.000 NA | NA |
| 1 spectrum, ILDLEDFEK | 0.000 | 0.000 | 0.097 | 0.000 | 0.000 | 0.476 | 0.427 | 0.000 | ||
| 1 spectrum, EVGALR | 0.276 | 0.161 | 0.000 | 0.000 | 0.000 | 0.000 | 0.563 | 0.000 |