10
10peptides
spectra
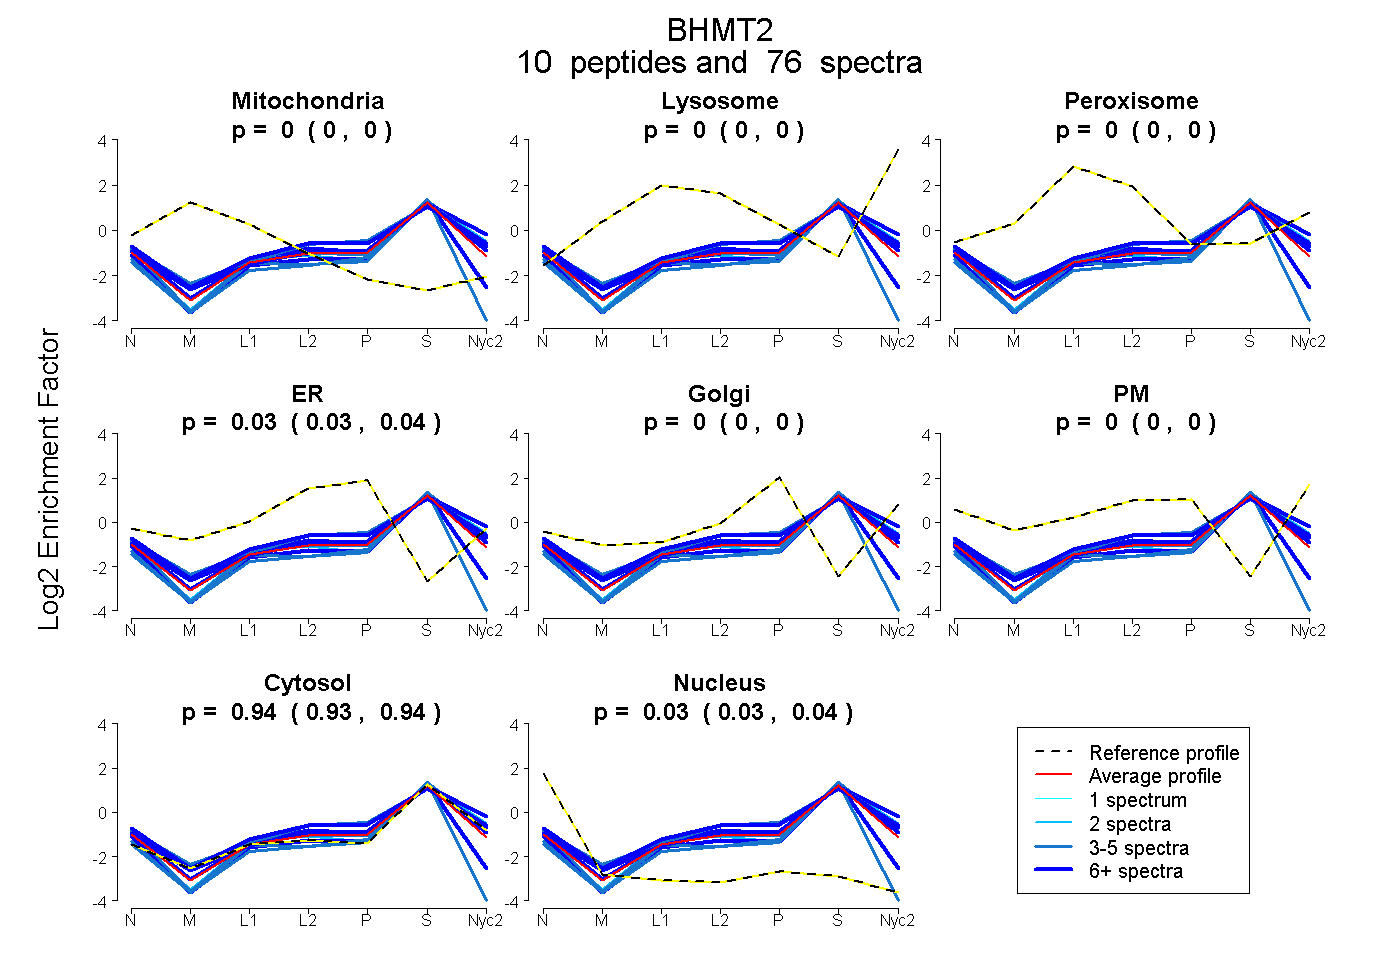
0.000 | 0.000
0.000 | 0.000
0.000 | 0.000
0.029 | 0.036
0.000 | 0.000
0.000 | 0.000
0.931 | 0.940
0.025 | 0.037
7peptides
spectra
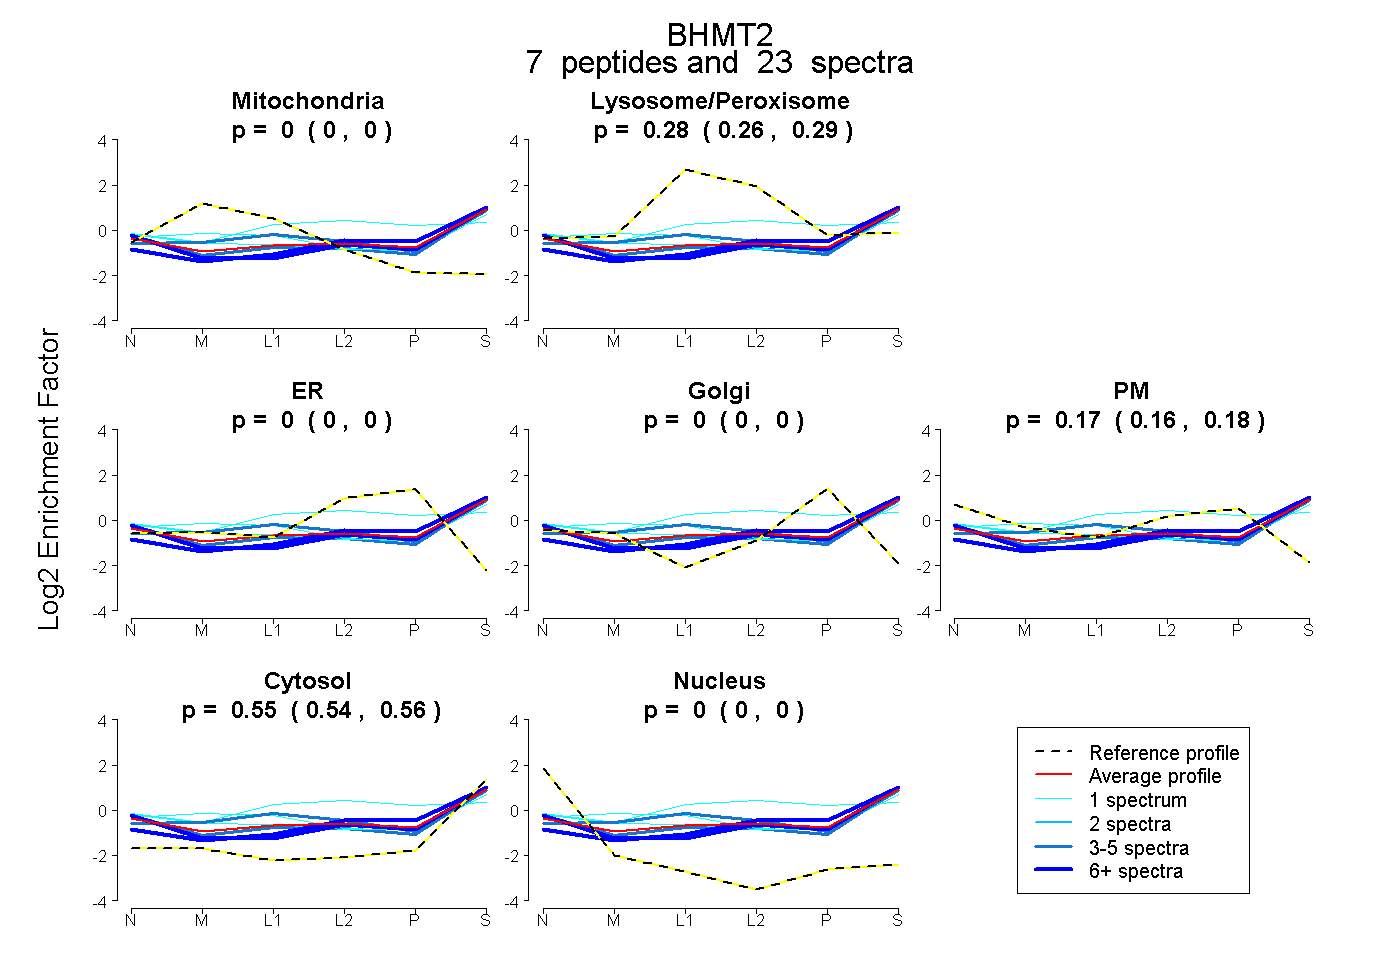
0.000 | 0.000
0.262 | 0.290
0.000 | 0.000
0.000 | 0.000
0.160 | 0.184
0.541 | 0.556
0.000 | 0.000