 10
10peptides
spectra
0.000 | 0.000
0.000 | 0.000
0.000 | 0.000
0.029 | 0.036
0.000 | 0.000
0.000 | 0.000
0.931 | 0.940
0.025 | 0.037
| Plot | Mito | Lyso | Perox | ER | Golgi | PM | Cytosol | Nucleus | |||||
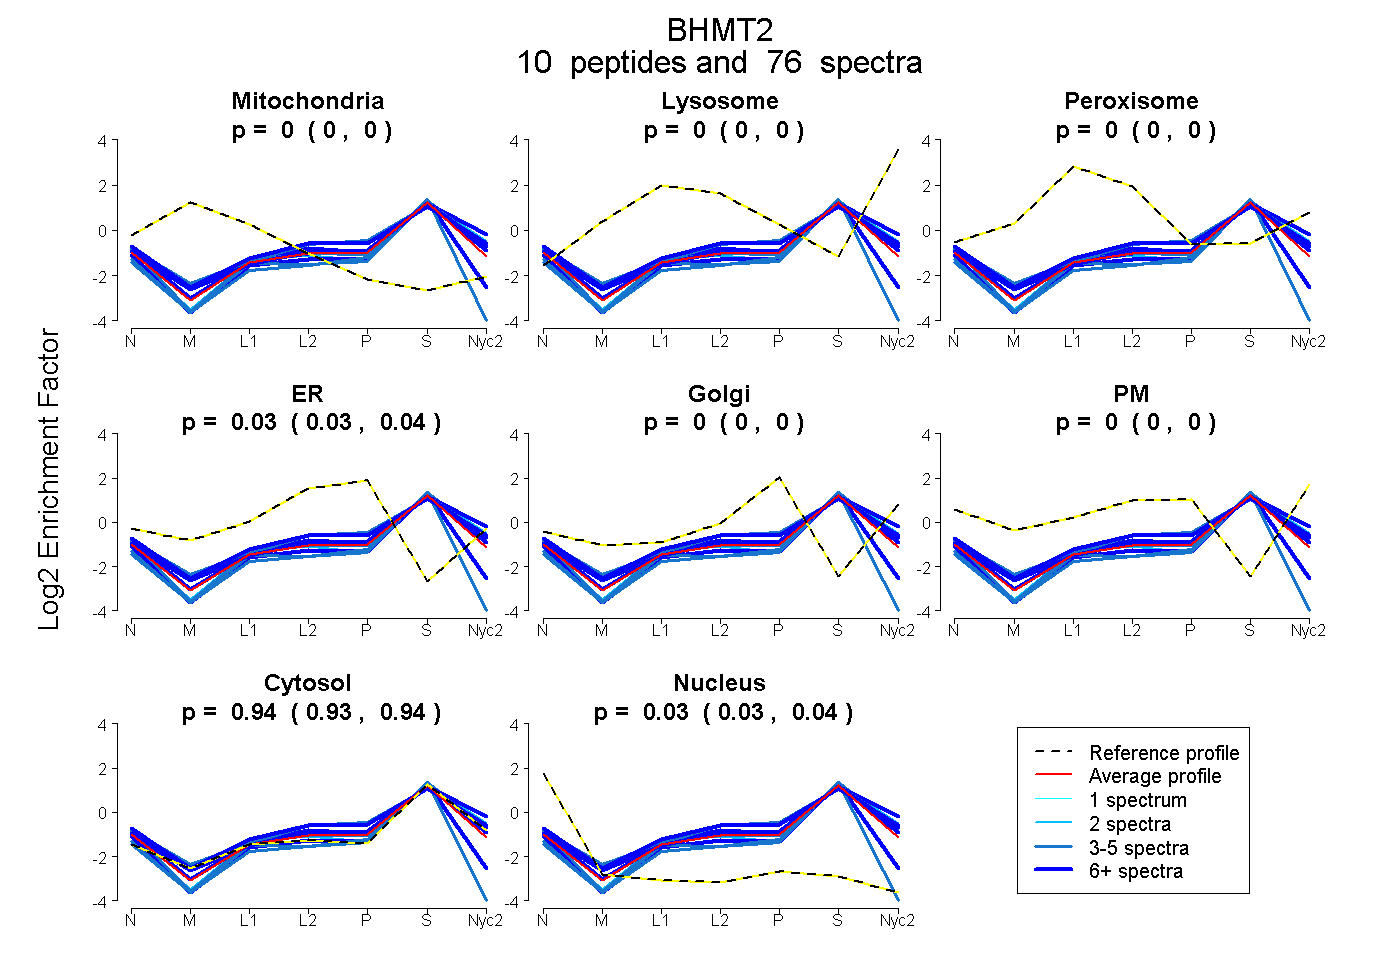
| Expt A |
10 peptides |
76 spectra |
|
0.000 0.000 | 0.000 |
0.000 0.000 | 0.000 |
0.000 0.000 | 0.000 |
0.032 0.029 | 0.036 |
0.000 0.000 | 0.000 |
0.000 0.000 | 0.000 |
0.936 0.931 | 0.940 |
0.032 0.025 | 0.037 |
| 4 spectra, DAGLQAHLMVQCLGFHTPDCGK | 0.000 | 0.000 | 0.000 | 0.000 | 0.000 | 0.000 | 0.778 | 0.222 | ||
| 12 spectra, APAGGPR | 0.000 | 0.000 | 0.000 | 0.053 | 0.000 | 0.000 | 0.927 | 0.021 | ||
| 7 spectra, FGPWTSLQTMK | 0.000 | 0.016 | 0.000 | 0.000 | 0.000 | 0.103 | 0.881 | 0.000 | ||
| 4 spectra, HGIWGSGLDMHTKPWIR | 0.000 | 0.000 | 0.000 | 0.115 | 0.029 | 0.029 | 0.826 | 0.000 | ||
| 8 spectra, QLHTEFLR | 0.000 | 0.000 | 0.000 | 0.109 | 0.000 | 0.057 | 0.834 | 0.000 | ||
| 10 spectra, LQLGVFAR | 0.000 | 0.000 | 0.000 | 0.039 | 0.038 | 0.011 | 0.912 | 0.000 | ||
| 2 spectra, AGADVLQTFTFSAAEDR | 0.000 | 0.000 | 0.000 | 0.000 | 0.000 | 0.001 | 0.999 | 0.000 | ||
| 4 spectra, GGFVDLPEYPFGLEPR | 0.000 | 0.000 | 0.000 | 0.003 | 0.009 | 0.016 | 0.959 | 0.014 | ||
| 22 spectra, AGANIIGVNCR | 0.000 | 0.000 | 0.000 | 0.000 | 0.000 | 0.000 | 0.861 | 0.139 | ||
| 3 spectra, AGLWTPEAVVEYPSAVR | 0.000 | 0.000 | 0.000 | 0.000 | 0.000 | 0.000 | 0.988 | 0.012 |
| Plot | Mito | Lyso or Perox | ER | Golgi | PM | Cytosol | Nucleus | ||||||
| Expt B |
7 peptides |
23 spectra |
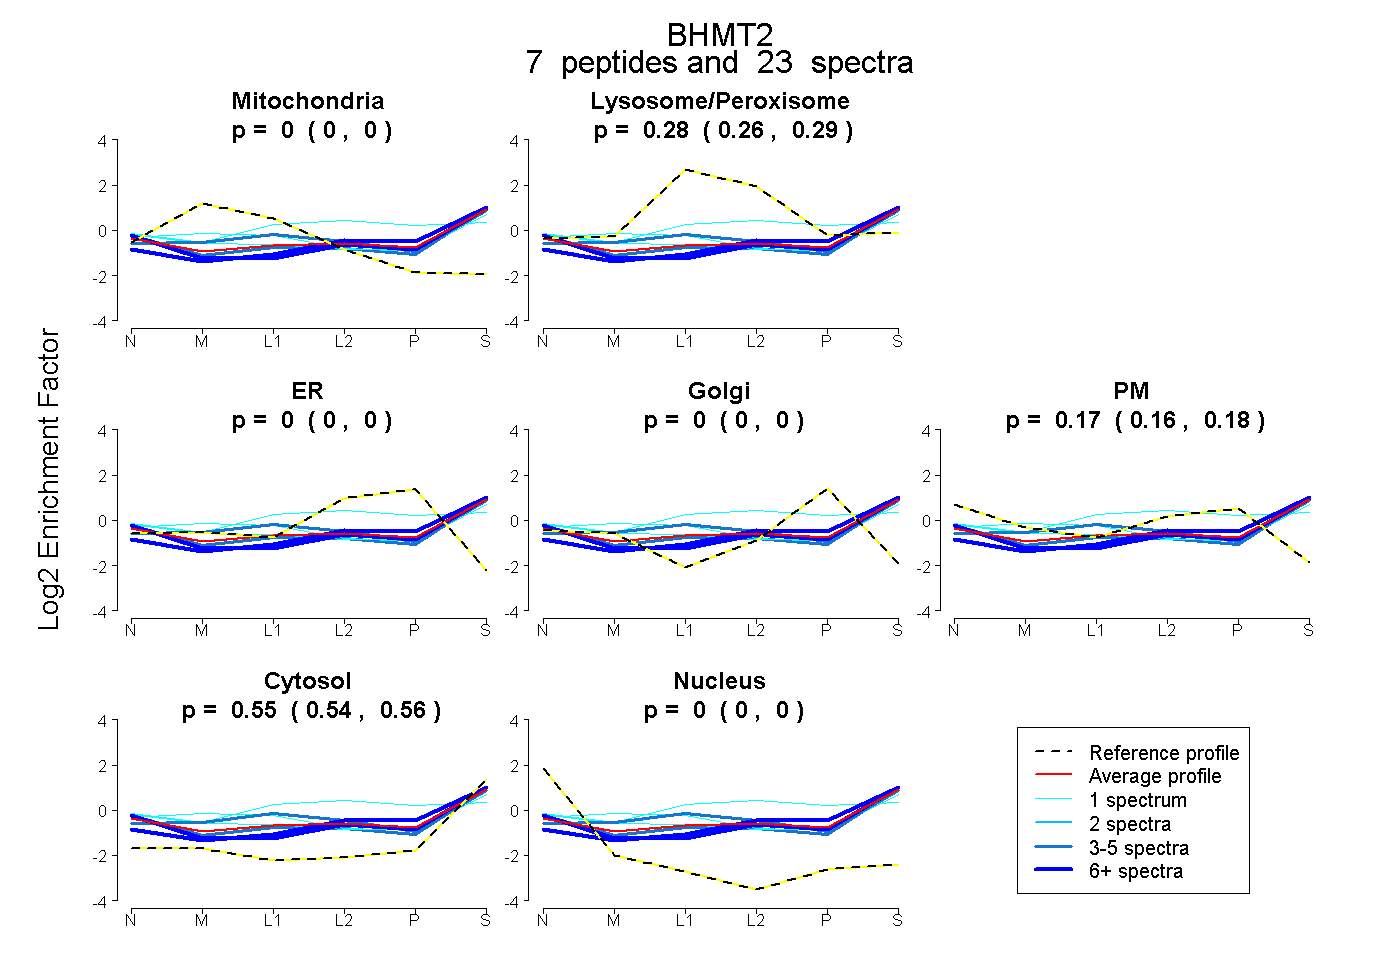 |
0.000 0.000 | 0.000 |
0.277 0.262 | 0.290 |
0.000 0.000 | 0.000 |
0.000 0.000 | 0.000 |
0.174 0.160 | 0.184 |
0.549 0.541 | 0.556 |
0.000 0.000 | 0.000 |
|||
| Plot | Lyso | Other | |||||||||||
| Expt C |
11 peptides |
107 spectra |
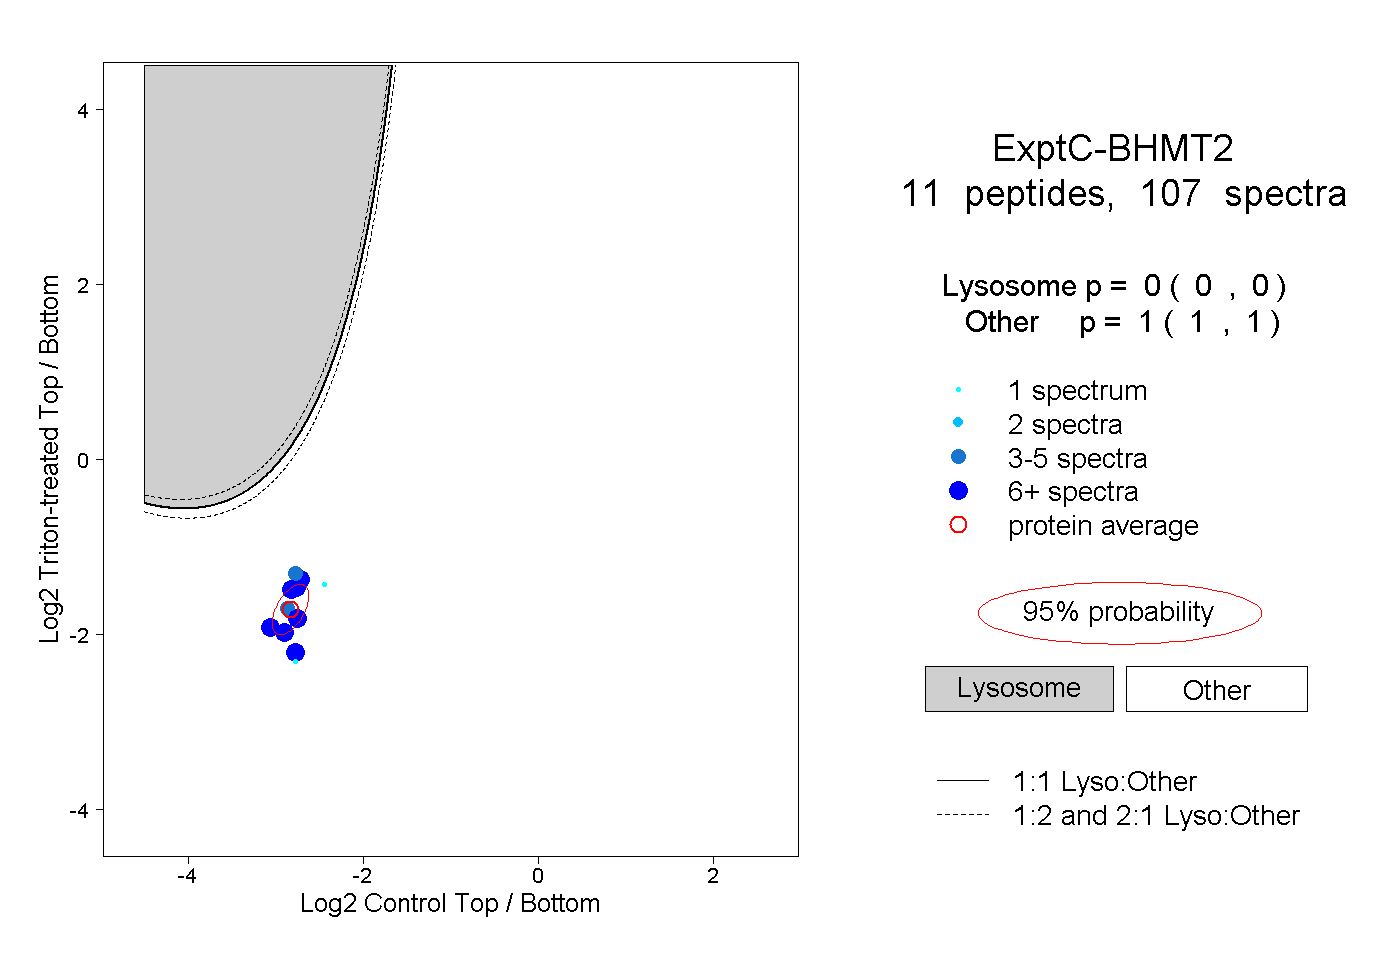 |
0.000 0.000 | 0.000 |
1.000 1.000 | 1.000 |
||||||||
| Plot | Lyso | Other | |||||||||||
| Expt D |
2 peptides |
4 spectra |
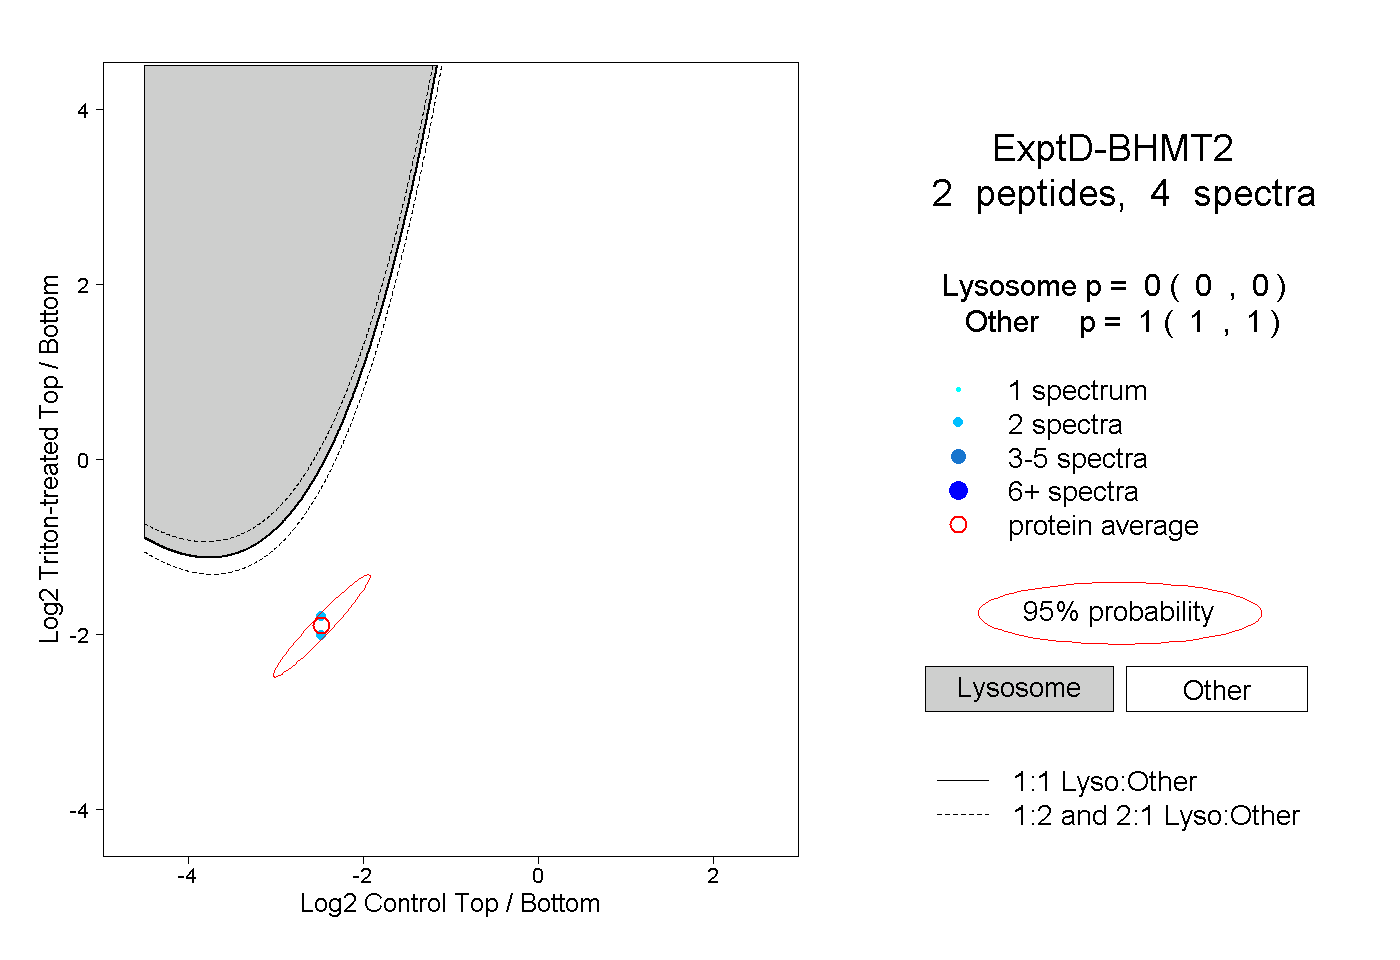 |
0.000 0.000 | 0.000 |
1.000 1.000 | 1.000 |