 1
1peptide
spectrum
NA | NA
NA | NA
NA | NA
NA | NA
NA | NA
NA | NA
NA | NA
7peptides
spectra
0.004 | 0.469
0.530 | 0.995
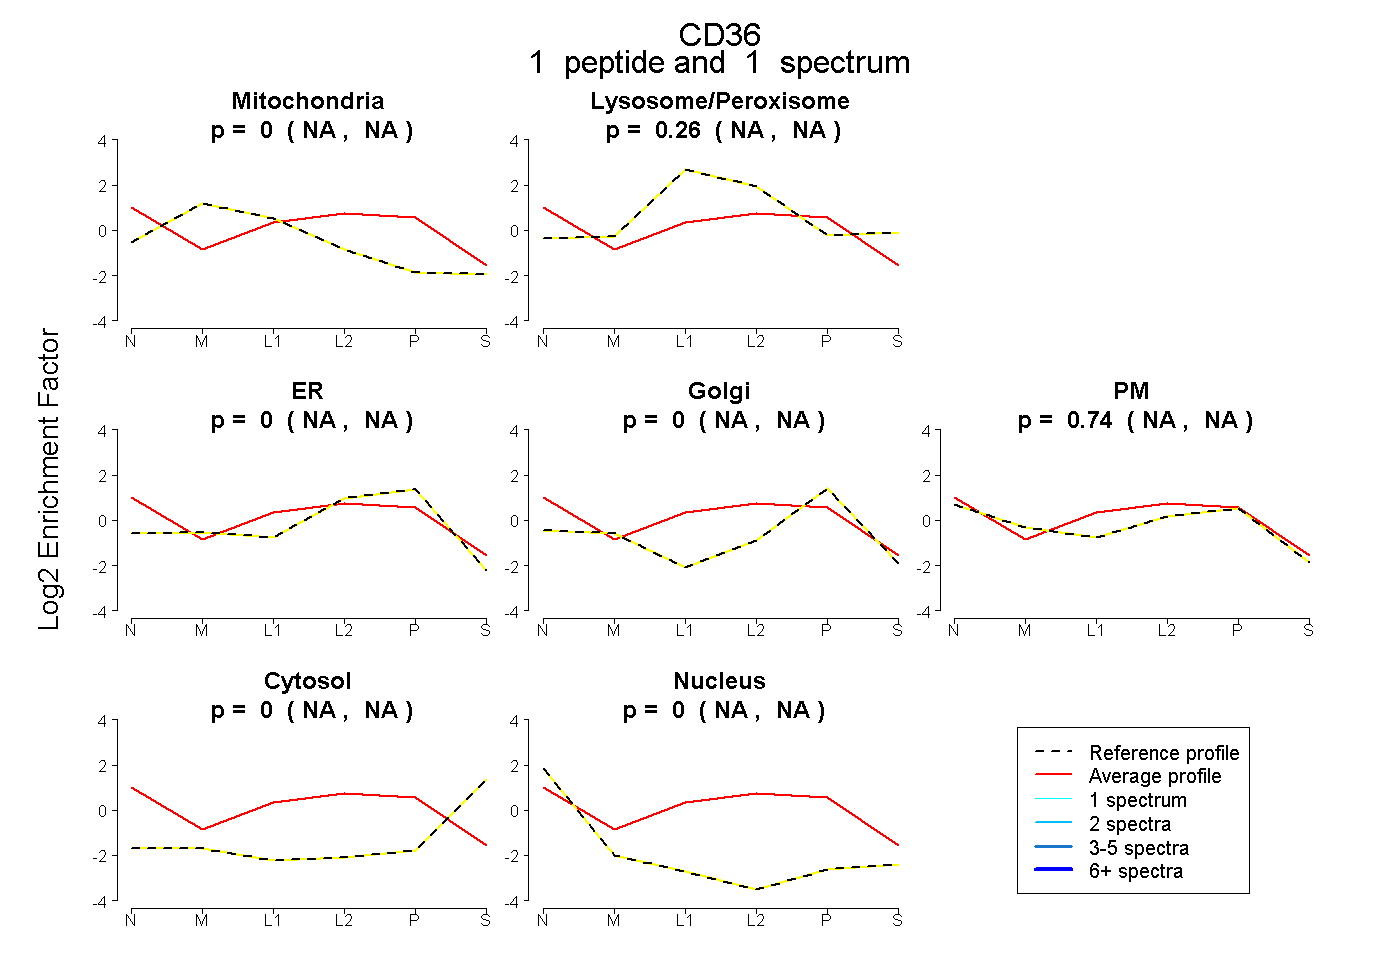
| Plot | Mito | Lyso or Perox | ER | Golgi | PM | Cytosol | Nucleus | ||||||
| Expt B |
1 peptide |
1 spectrum |
|
0.000 NA | NA |
0.257 NA | NA |
0.000 NA | NA |
0.000 NA | NA |
0.743 NA | NA |
0.000 NA | NA |
0.000 NA | NA |
|||
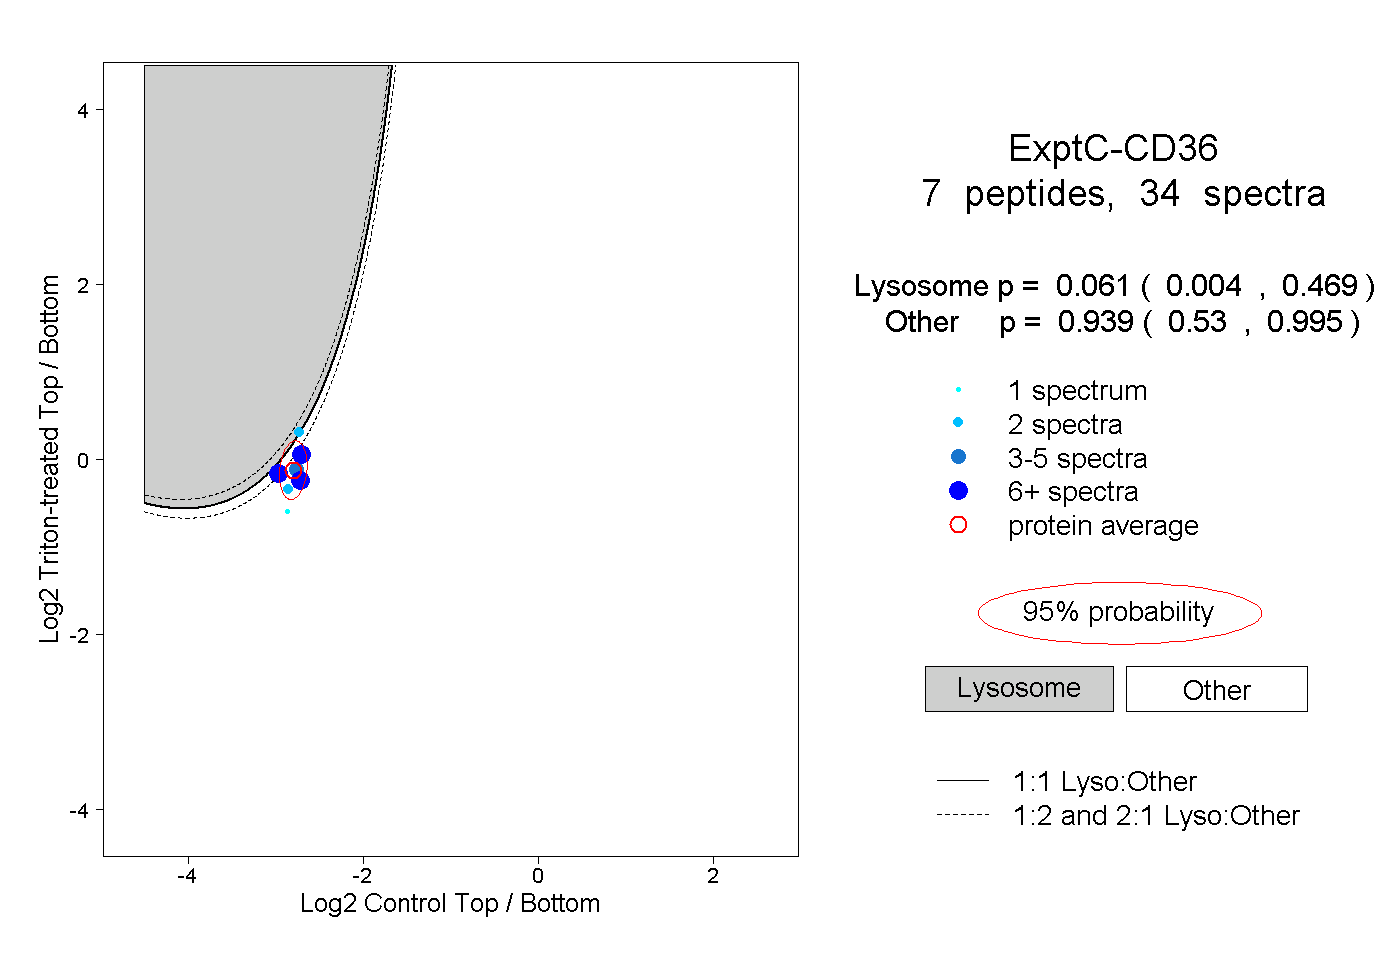
| Plot | Lyso | Other | |||||||||||
| Expt C |
7 peptides |
34 spectra |
|
0.061 0.004 | 0.469 |
0.939 0.530 | 0.995 |
| 1 spectrum, SSMFQTR | 0.002 | 0.998 | ||||||||
| 9 spectra, NQVTGK | 0.008 | 0.992 | ||||||||
| 9 spectra, GPYTYR | 0.251 | 0.749 | ||||||||
| 3 spectra, FFSSDICR | 0.046 | 0.954 | ||||||||
| 8 spectra, VAIIDTYK | 0.084 | 0.916 | ||||||||
| 2 spectra, EVVLEEGTIAFK | 0.529 | 0.471 | ||||||||
| 2 spectra, TGTTVYR | 0.018 | 0.982 |