 14
14peptides
spectra
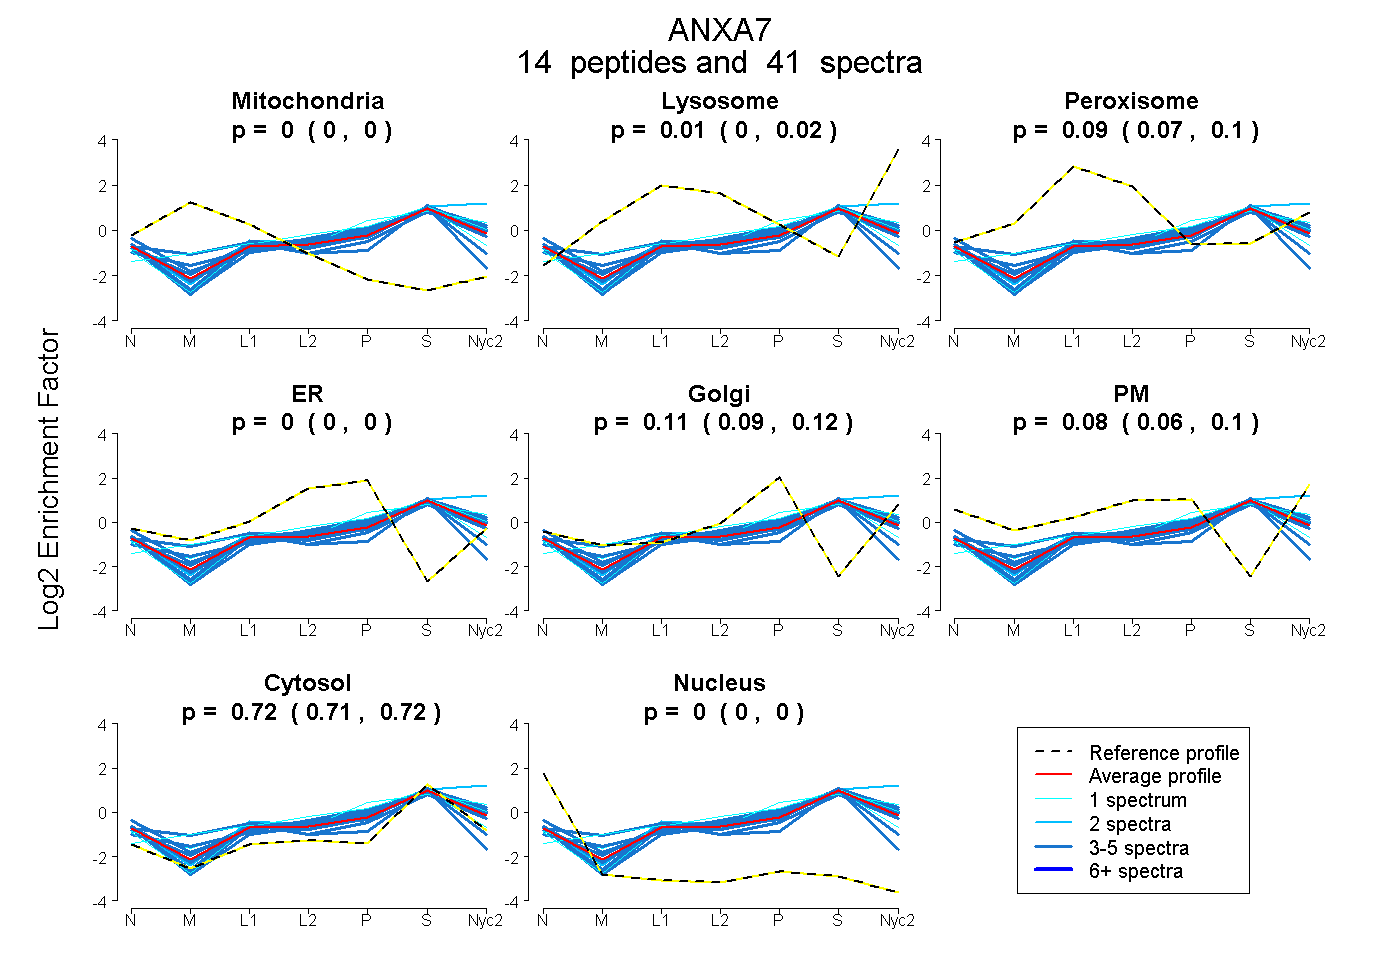
0.000 | 0.000
0.000 | 0.020
0.072 | 0.101
0.000 | 0.000
0.085 | 0.122
0.061 | 0.100
0.709 | 0.720
0.000 | 0.000
6peptides
spectra
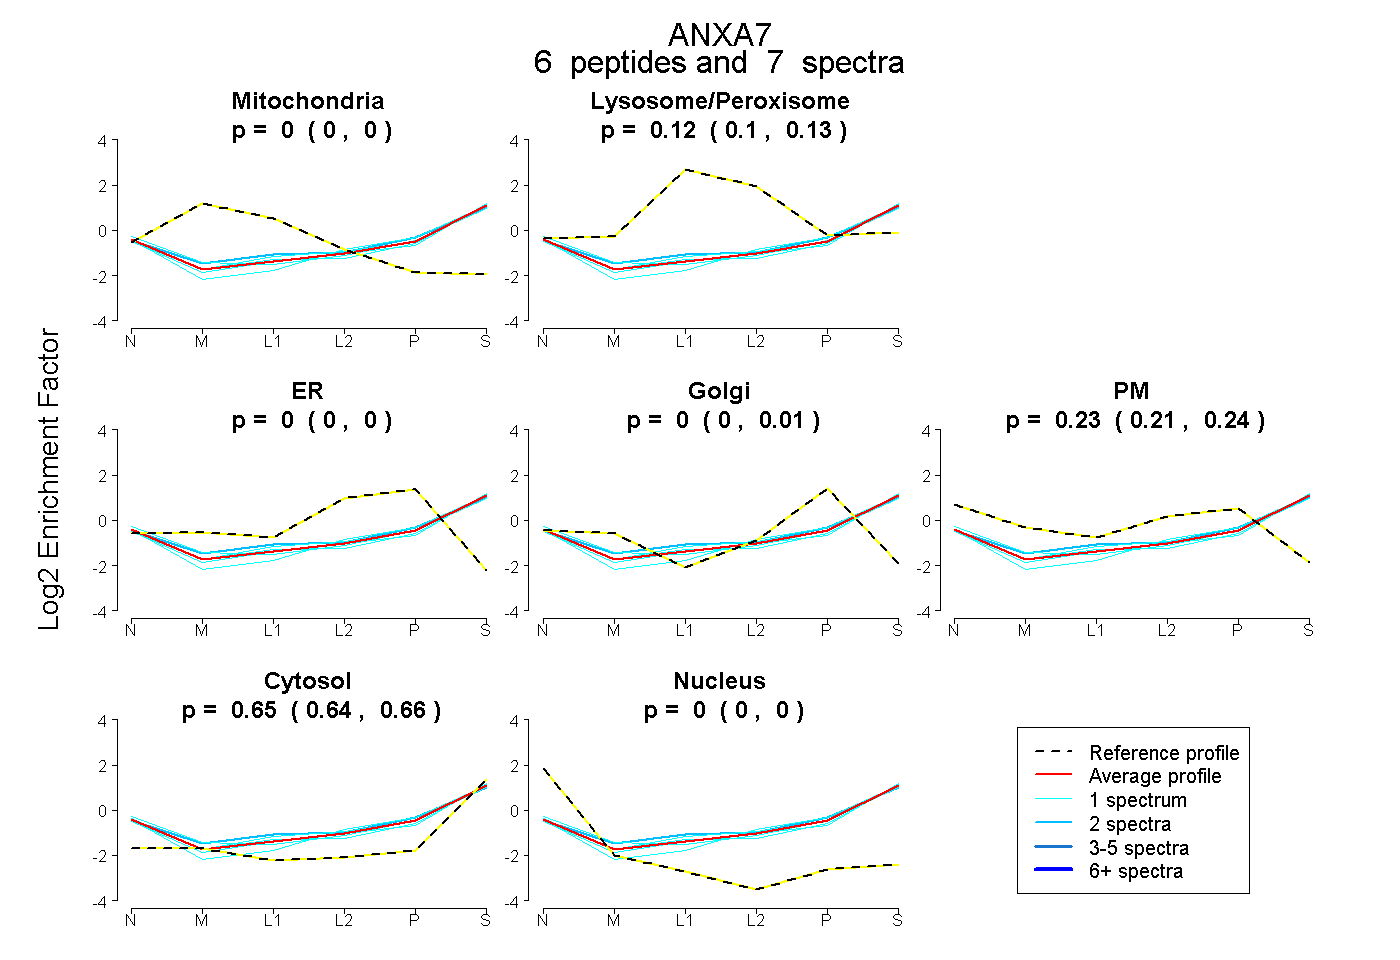
0.000 | 0.000
0.104 | 0.130
0.000 | 0.000
0.000 | 0.011
0.213 | 0.240
0.643 | 0.657
0.000 | 0.000
11peptides
spectra
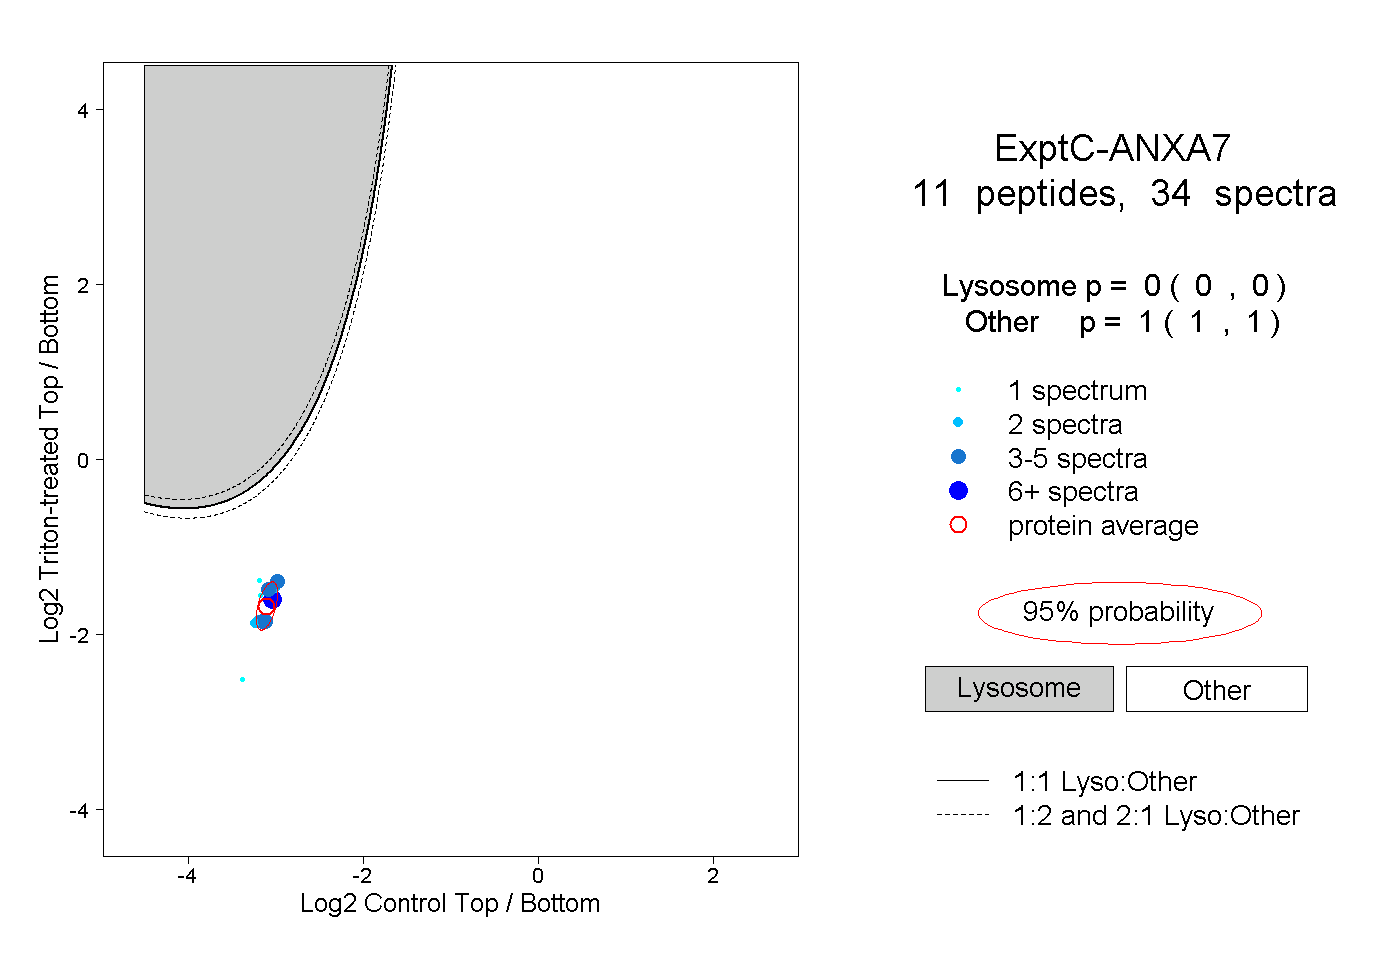
0.000 | 0.000
1.000 | 1.000
2peptides
spectra
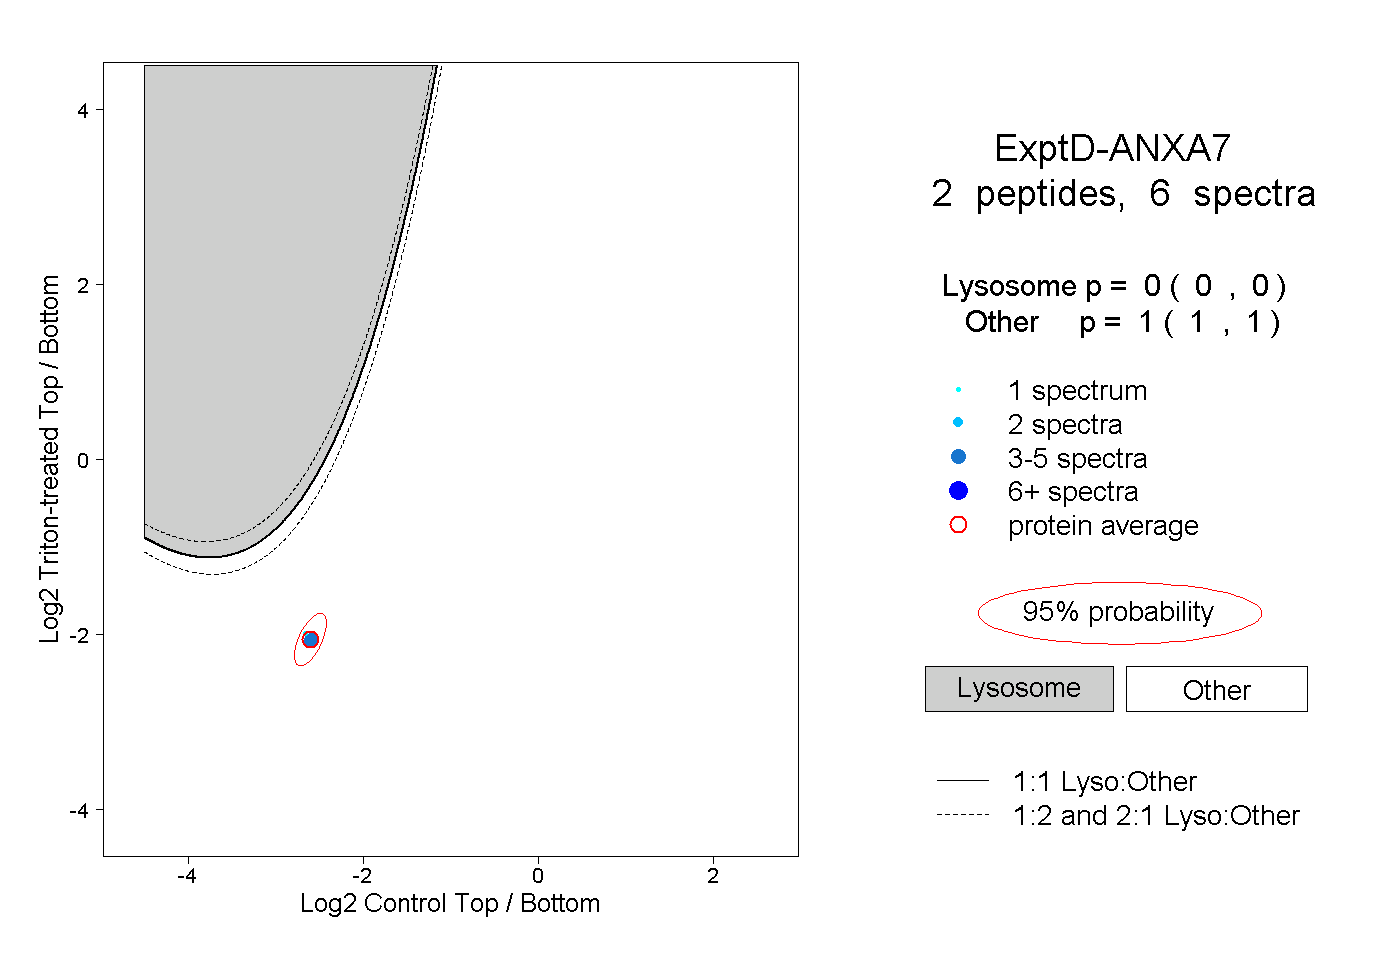
0.000 | 0.000
1.000 | 1.000