 4
4peptides
spectra
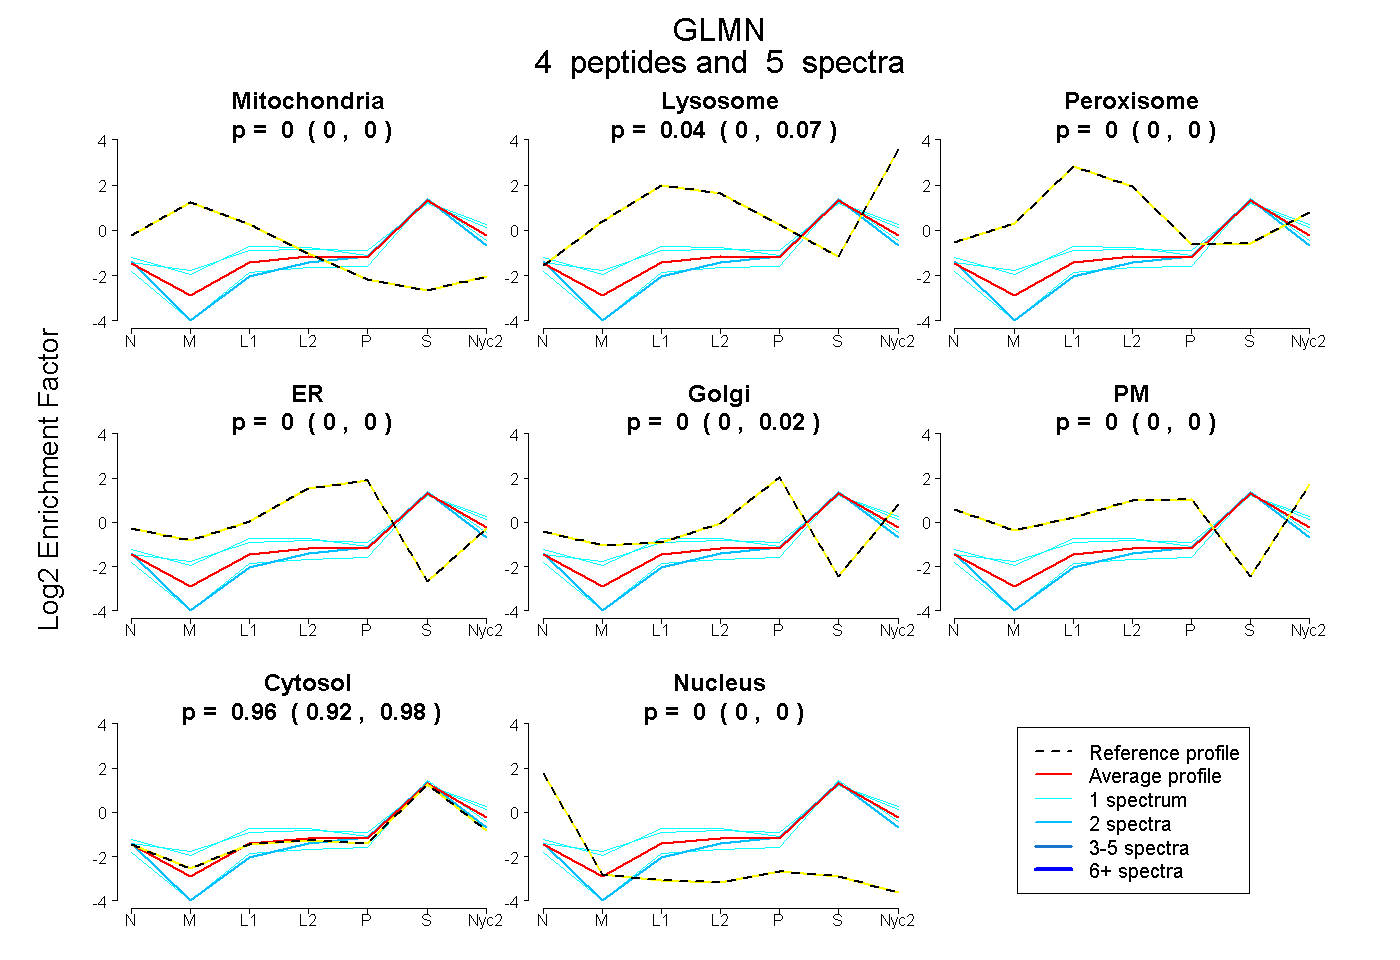
0.000 | 0.000
0.000 | 0.071
0.000 | 0.000
0.000 | 0.000
0.000 | 0.022
0.000 | 0.000
0.924 | 0.985
0.000 | 0.000
| Plot | Mito | Lyso | Perox | ER | Golgi | PM | Cytosol | Nucleus | |||||
| Expt A |
4 peptides |
5 spectra |
|
0.000 0.000 | 0.000 |
0.040 0.000 | 0.071 |
0.000 0.000 | 0.000 |
0.000 0.000 | 0.000 |
0.000 0.000 | 0.022 |
0.000 0.000 | 0.000 |
0.960 0.924 | 0.985 |
0.000 0.000 | 0.000 |
| 2 spectra, VEELIEIK | 0.000 | 0.000 | 0.000 | 0.000 | 0.000 | 0.000 | 0.987 | 0.013 | ||
| 1 spectrum, IMASLNLLR | 0.000 | 0.186 | 0.000 | 0.000 | 0.000 | 0.000 | 0.814 | 0.000 | ||
| 1 spectrum, TMGWNLVGPVVR | 0.000 | 0.195 | 0.000 | 0.000 | 0.000 | 0.000 | 0.805 | 0.000 | ||
| 1 spectrum, GLELLETSLLR | 0.000 | 0.000 | 0.000 | 0.000 | 0.000 | 0.000 | 1.000 | 0.000 |
| Plot | Lyso | Other | |||||||||||
| Expt C |
1 peptide |
1 spectrum |
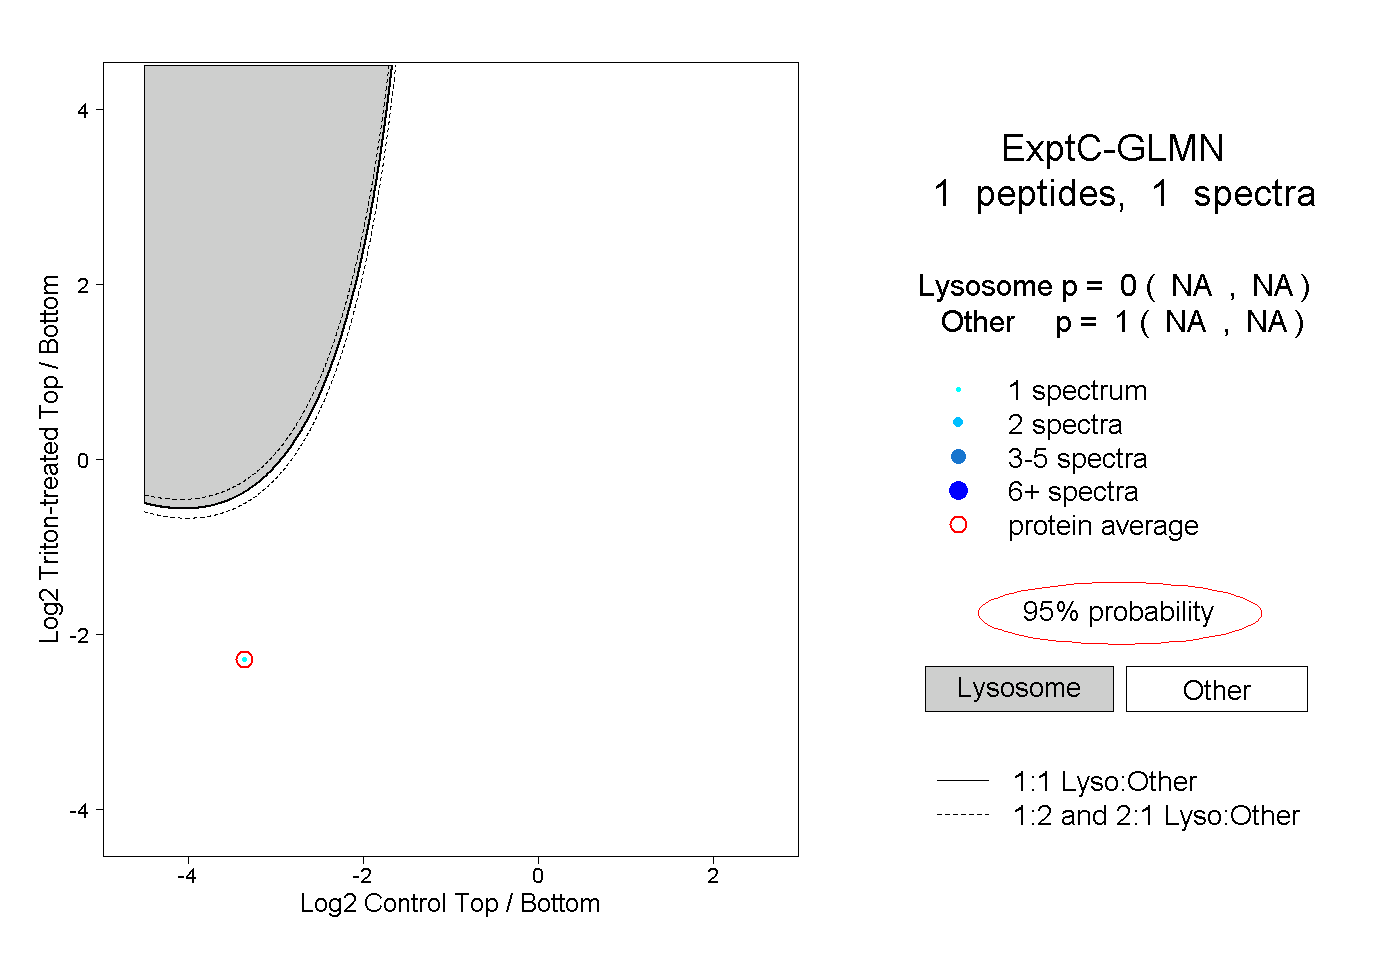 |
0.000 NA | NA |
1.000 NA | NA |