 1
1peptide
spectra
0.000 | 0.000
0.000 | 0.104
0.299 | 0.405
0.000 | 0.000
0.000 | 0.000
0.000 | 0.000
0.538 | 0.568
0.024 | 0.045
1peptide
spectra
NA | NA
NA | NA
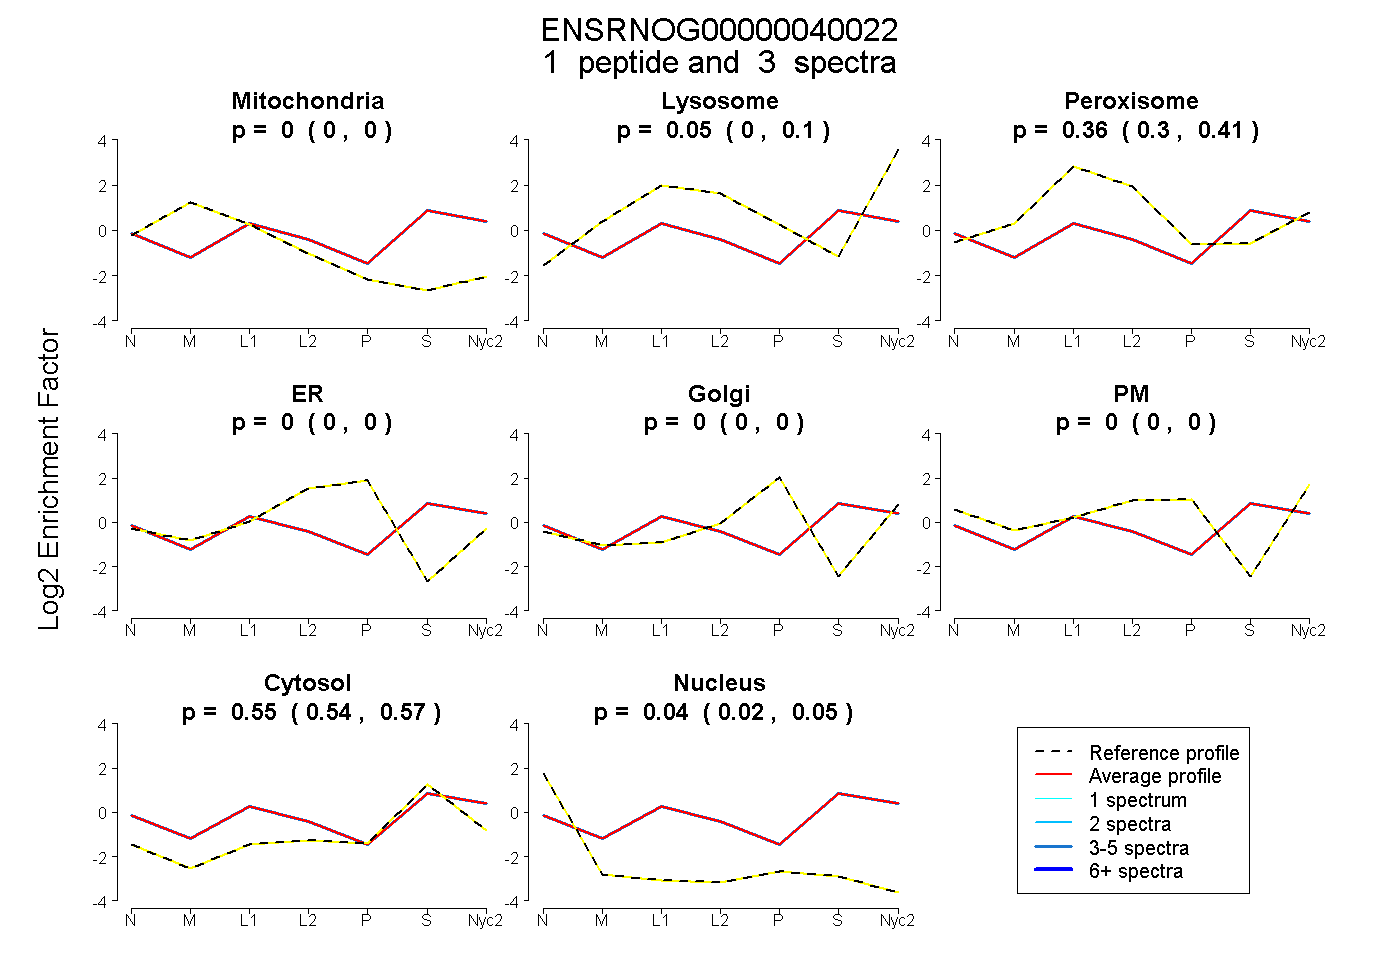
| Plot | Mito | Lyso | Perox | ER | Golgi | PM | Cytosol | Nucleus | |||||
| Expt A |
1 peptide |
3 spectra |
|
0.000 0.000 | 0.000 |
0.048 0.000 | 0.104 |
0.362 0.299 | 0.405 |
0.000 0.000 | 0.000 |
0.000 0.000 | 0.000 |
0.000 0.000 | 0.000 |
0.555 0.538 | 0.568 |
0.035 0.024 | 0.045 |
||
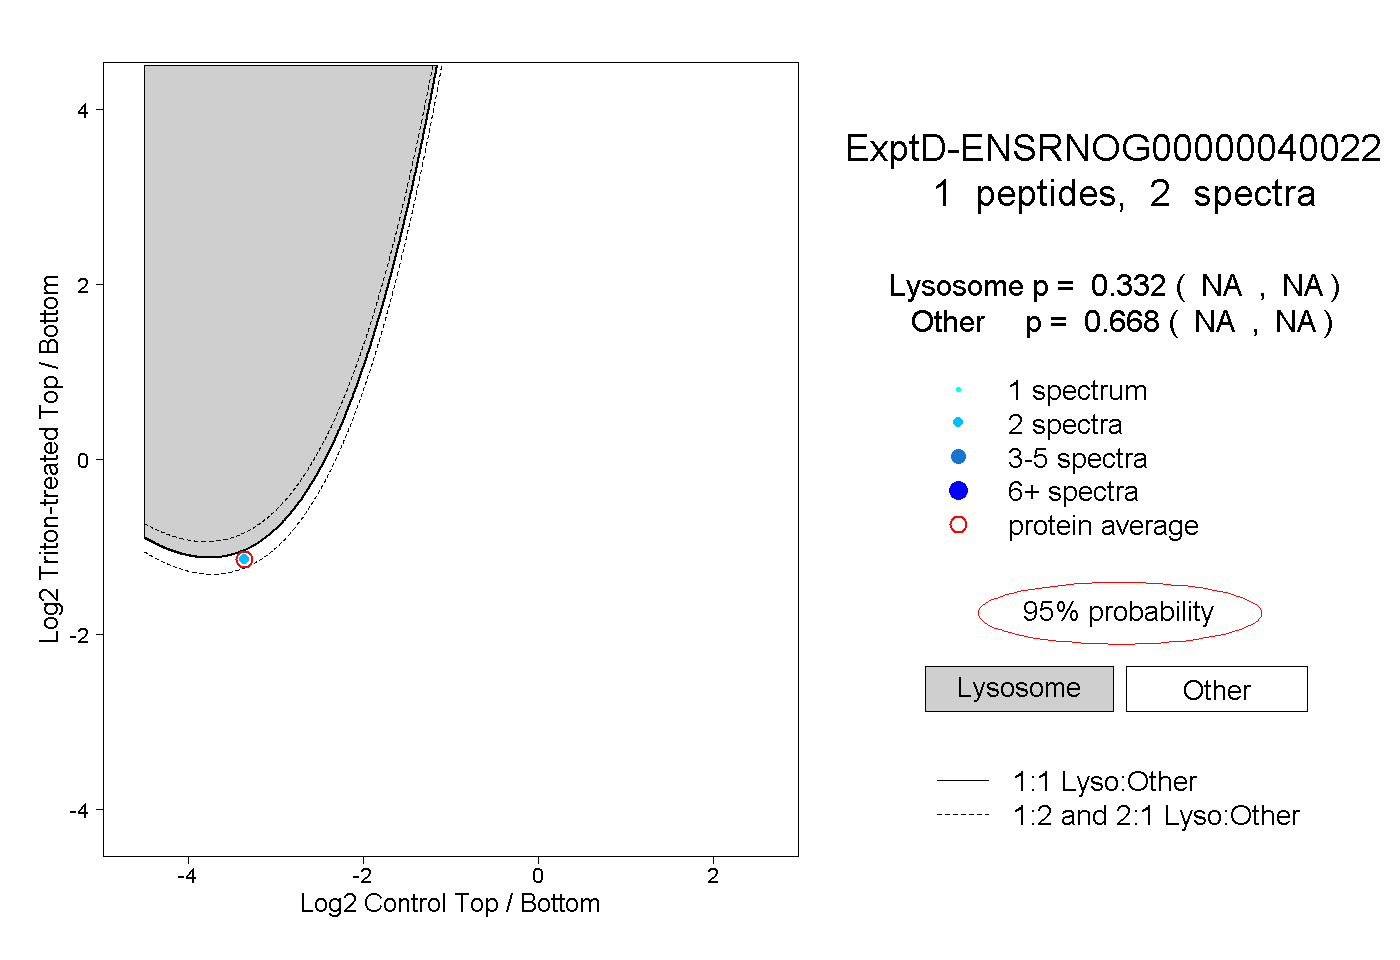
| Plot | Lyso | Other | |||||||||||
| Expt D |
1 peptide |
2 spectra |
|
0.332 NA | NA |
0.668 NA | NA |